While cases of TB have significantly decreased globally, many are still at risk, particularly in endemic countries.
Chest imaging, specifically computed tomography (CT), is a favored diagnostics and monitoring tool for those diagnosed with TB, as it can be used to track changes and analyze the severity of the disease.
In comparison, radiological techniques are used to predict the type and activity of TB, which can help inform decisions by healthcare workers.
Still, CT scans are not ideal. Results are often challenging and complex, with countries that lack strong medical infrastructure suffering from missed reporting and underdiagnosis.
Artificial intelligence is steadily becoming a prominent fixture in a myriad of sectors, particularly the medical sector. Deep learning (DL) has seen increasing use in medical imaging, such as for disease classification and lung cancer screening by CT chest scans.
Previous research has indicated the potential use of CT-based DL strategies to aid radiological diagnostic methods. Building from this, researchers developed a completely automated CT image analysis system utilizing AI technologies. The team hope that this approach will help pulmonary TB patients receive improved care through enhanced detection, diagnosis and monitoring.
The researchers published their results in the journal European Radiology.
Methodology
The researchers procured chest CT scans of suspected TB patients from December 2017 to September 2020. They collected a total of 1356 CT scans of 865 patients which met various inclusion criteria (see Figure 1).
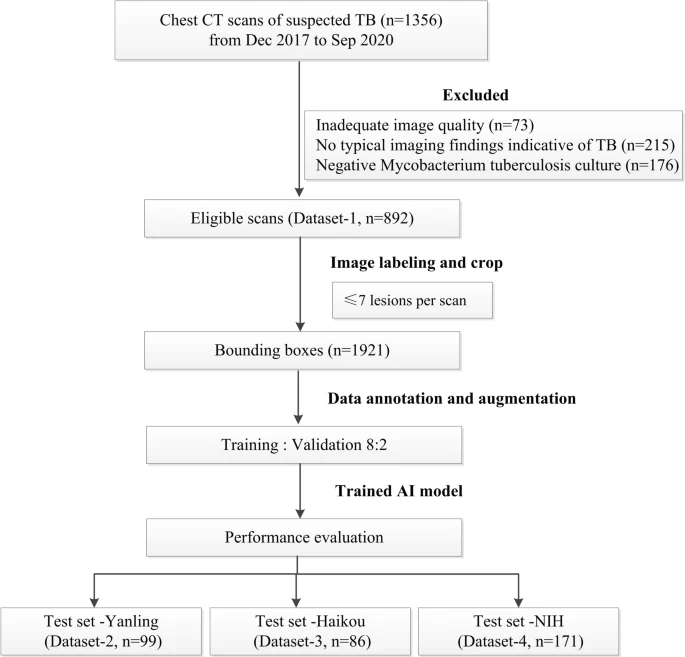
Figure 1. Flowchart of the study process for the training and testing datasets. Image Credit: Yan, et al., 2021
The chest CT was procured from different CT scanners from various centers, and Table 1 summarizes the acquisition and reconstruction parameters. A three-dimensional reconstruction approach was utilized to envision the severity of TB.
Table 1. Chest CT acquisition parameters of different datasets. Source: Yan, et al., 2021
| CT scanners |
Development dataset |
Test dataset (Yanling)* |
Test dataset (Hainan) |
Philips Brilliance
iCT |
Siemens SOMATOM Definition |
GE
Revolution |
Siemens Emotion
16 |
Philips Brilliance
iCT |
| Scan number |
519 |
336 |
37 |
99 |
86 |
| Tube voltage |
120 kVp |
110–120 kVp |
100 kVp |
130 kVp |
120 kVp |
| Tube current |
Automatic mA modulation |
Automatic mA modulation |
Automatic mA modulation |
184 mA |
Automatic mA modulation |
| Pitch |
0.991 |
1.2 |
0.992 |
1.2 |
0.993 |
| Detector configuration |
128 × 0.625 mm |
192 × 0.6 mm |
128 × 0.625 mm |
192 × 0.6 mm |
128 × 0.625 mm |
| Resolution |
512 × 512 |
512 × 512 |
512 × 512 |
512 × 512 |
512 × 512 |
| Section thickness |
1 mm |
1–1.5 mm |
1.25 mm |
1.5 mm |
5 mm |
*Scanning parameters from the NIH open-source dataset are not available
To develop and optimize the DL algorithm for lesion localization and classification, data annotation was carried out by a thoracic radiologist and verified by an expert radiologist.
Initially, abnormal slices containing typical pulmonary TB lesions and normal slices without pathological findings were marked manually and were used as standards to train the DL network.
For every CT scan, the TB-related imaging features were analyzed based on the Fleischner Society Glossary, and the center layers harboring the maximum areas of TB lesions were labeled.
Convolutional neural network (CNN)–dependent cascading networks were spontaneously linked to generating an end-to-end processing pipeline (see Figure 2).
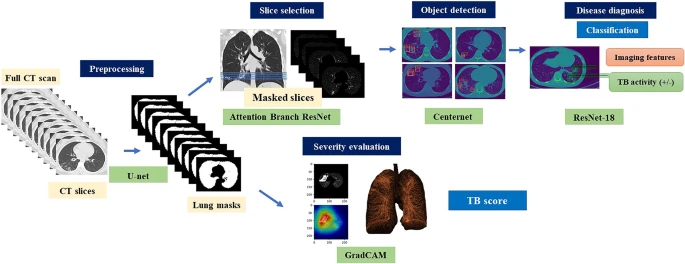
Figure 2. Illustration of the proposed cascading AI pipeline. The AI diagnostic system consists of four subsystems, which provides consistent visual descriptions: (1) screening to distinguish between normal and abnormal CT images, (2) object detection and localization of pulmonary infectious lesions, (3) diagnostic assessment of radiological features (6 types) and TB activity, and (4) severity assessment. Image Credit: Yan, et al., 2021
The AI model initially identified the abnormal CT slices depending on the Attention Branch ResNet and the Sigmoid function was utilized as the last activation function (see Figure 3).
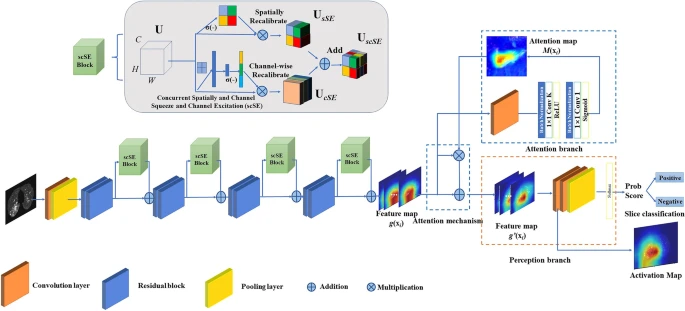
Figure 3. CNN architecture of a deep learning system for slice selection and disease evaluation. The neural network architecture of the subsystem is based on Attention Branch ResNet and Grad-CAM. The convolution (Conv) layers are used to filter the input full CT scan and extract effective features. Image Credit: Yan, et al., 2021
The developed model’s performance was later evaluated independently at three datasets.
A confusion matrix was used to analyze multiclass classifiers, while the precision, recall, and a highly balanced F1_score were employed to evaluate the performance by class.
Spearman correlation analysis was carried out to analyze the correlations between the TB score as determined by the algorithm and radiologist-estimated CT score. The Student’s t-test compared the TB scores of non-severe and severe patients.
Results
The acquired dataset had 892 scans of 526 patients (206 women and 320 men) with clinically diagnosed TB.
The AI cascading models had four subsystems that consistently provided visual descriptions. Slice-level analysis was carried out to select the top 10 positive slices based on the predicted probability for each CT scan.
The study employed an advanced real-time object identification algorithm depending on the CenterNet detection framework to localize lesions.
The classification CNN showed a training accuracy of 99.6 ± 1.0% indicative of TB. Figure 4 illustrates the critical imaging findings predicted by the AI model.
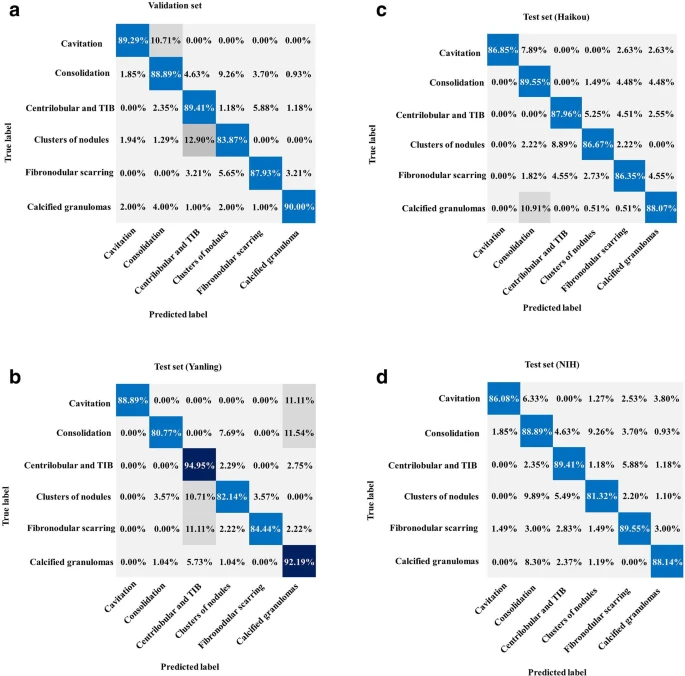
Figure 4. Performance of the AI system for classification. (a) Normalized confusion matrices of multiclass critical imaging feature classification for the validation and test datasets. (b) Normalized confusion matrices of disease activity prediction for the test datasets. The shaded cells indicate the correct results obtained by the AI system. Image Credit: Yan, et al., 2021
To evaluate the general applicability of the designed AI system, CT images were procured from the NIH open-source dataset. Table 2 lists the predictive performances of the equivalent recall, precision, and F1 score by class.
Table 2. Performance of the AI model for classification and diagnosis in the testing phase. Source: Yan, et al., 2021
| |
Test set (dataset 2) |
Test set (dataset 3) |
Test set (dataset 4) |
| |
Recall (%) |
Precision (%) |
F1 score |
Recall (%) |
Precision (%) |
F1 score |
Recall (%) |
Precision (%) |
F1 score |
| Cavitation |
88.89% |
100.00% |
94.12% |
86.85% |
100.00% |
92.96% |
86.08% |
95.77% |
90.67% |
| Consolidation |
80.77% |
87.50% |
84.00% |
89.55% |
87.50% |
88.51% |
88.89% |
72.73% |
80.00% |
| Centrilobular and tree-in-bud |
94.95% |
91.59% |
93.24% |
87.96% |
91.59% |
89.74% |
83.76% |
92.65% |
87.98% |
| Clusters of nodules |
82.14% |
69.70% |
75.41% |
86.67% |
69.70% |
77.26% |
81.32% |
67.27% |
73.63% |
| Fibronodular scarring |
84.44% |
97.44% |
90.48% |
86.35% |
97.44% |
91.56% |
89.55% |
70.59% |
78.95% |
| Calcified granulomas |
92.19% |
94.15% |
93.16% |
88.07% |
94.15% |
91.01% |
88.14% |
94.49% |
91.20% |
| Active/Inactive |
100.00% |
92.68% |
96.20% |
94.87% |
94.87% |
94.87% |
97.87% |
98.98% |
98.42% |
Note. Data in brackets are 95% confidence interval
AI artificial intelligence
The extent of the disease was assessed with a Grad-CAM framework which automatically highlights pulmonary lesions. The AI-discovered suspicious infectious areas correlated with the actual pulmonary TB lesions (see Figure 5).
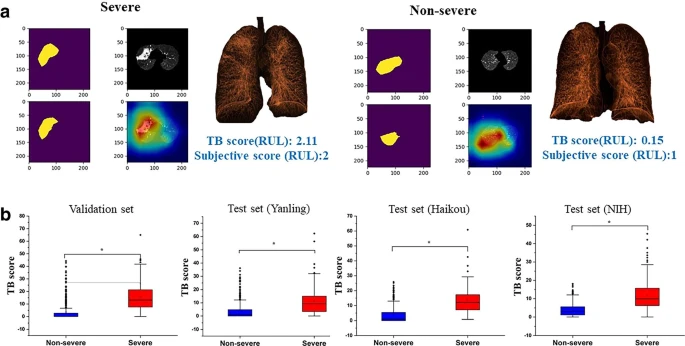
Figure 5. (a) AI-identified suspicious infectious areas on images of severe and non-severe disease. Pseudocolor map represents the three-dimensional reconstruction of the lesion. (b) Boxplots comparing TB scores per lobe between severe and non-severe patients for the validation and test datasets. Image Credit: Yan, et al., 2021
Table 3 lists the Spearman correlation results between the radiologist-estimated CT score and the AI model–quantified TB score. The TB scores per lobe were substantially greater in patients with severe disease compared to non-severe disease in the validation.
Table 3. Correlation coefficient (r) of AI quantified TB score and radiologist-estimated subjective scores of the lung lobes. Source: Yan, et al., 2021
| |
Validation set |
Test set (Yanling) |
Test set (Haikou) |
Test set (NIH) |
| LUL |
0.713 |
0.655 |
0.652 |
0.762 |
| LLL |
0.649 |
0.582 |
0.579 |
0.692 |
| RUL |
0.723 |
0.542 |
0.660 |
0.564 |
| RML |
0.624 |
0.531 |
0.600 |
0.402 |
| RLL |
0.545 |
0.534 |
0.580 |
0.503 |
AI artificial intelligence, LUL left upper lobe, LLL left lower lobe, RUL right upper lobe, RML left middle lobe, RLL right lower lobe, TB tuberculosis
Figure 6 depicts examples of TB and the corresponding prediction results.
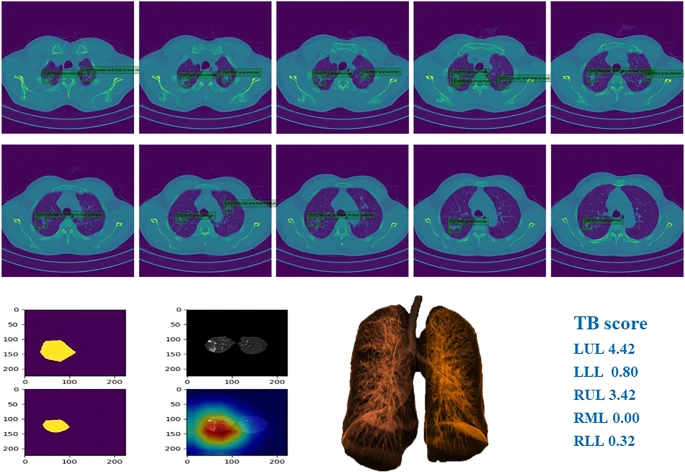
Figure 6. Example of chest CT images of patients with pulmonary TB and performance of our AI model. Image Credit: Yan, et al., 2021
Conclusions
The designed model was found to be beneficial for identifying and classifying crucial imaging features for tuberculosis analysis. Furthermore, the automated AI cascading model was able to indicate areas indicative of infection with human-level accuracy.
With an algorithmic approach, patients could be split into groups based on their disease severity, and accurate assessment of TB lesions were completed.
Utilizing an AI-based system to automate the critical stages of pulmonary TB triage and diagnosis could significantly improve the accessibility and accuracy of tuberculosis detection. Not only that, but this model could help to guide the clinical decisions made by practitioners, contributing to the overall management of TB patient care.
More research will be required before this technology sees wider use, as researchers cited their small sample size and decreased coverage of the rarer manifestations of pulmonary TB to be some of the main limitations.
Still, the potential AI holds to advance patient care for infectious diseases is an exciting development to follow.
Continue reading: Advancing Cardiovascular Care Through the Use of AI.
Journal Reference:
Yan, C., Wang, L., Lin, J., Xu, J., Zhang, T., Qi, J., Li, X., Ni, W., Wu, G., Huang, J., Xu, Y., Woodruff, H. C., Lambin, P. (2021) A fully automatic artificial intelligence–based CT image analysis system for accurate detection, diagnosis, and quantitative severity evaluation of pulmonary tuberculosis. European Radiology. Available online: https://link.springer.com/article/10.1007/s00330-021-08365-z#citeas.
References and Further Reading
- GBD Tuberculosis Collaborators (2018) The global burden of tuberculosis: results from the global burden of disease study 2015. The Lancet Infectious Diseases, 18, pp. 261–284.
- Furin, J., et al. (2019) Tuberculosis. Lancet, 393, pp. 1642–1656.
- Dheda, K., et al. (2014) Global control of tuberculosis: from extensively drug-resistant to untreatable tuberculosis. The Lancet Respiratory Medicine, 2, pp. 321–338. https://doi.org/10.1016/S2213-2600(14)70031-1
- Skoura, E., et al. (2015) Imaging in Tuberculosis. International Journal of Infectious Diseases, 32, pp. 87–93. doi.org/10.1101%2Fcshperspect.a017814.
- Nachiappan, A. C., et al. (2017) Pulmonary tuberculosis: role of radiology in diagnosis and management. Radiographics, 37, pp. 52–72. doi.org/10.1148/rg.2017160032.
- Chassagnon, G., et al. (2020) Artificial intelligence applications for thoracic imaging. European Journal of Radiology, 123, p. 108774. doi.org/10.1016/j.ejrad.2019.108774.
- Hosny, A., et al. (2018) Artificial intelligence in radiology. Nature Reviews Cancer, 18, pp. 500–510. doi.org/10.1038%2Fs41568-018-0016-5.
- Liu, Y., et al. (2020) A deep learning system for differential diagnosis of skin diseases. Nature Medicine, 26, pp. 900–908. doi.org/10.1038/s41591-020-0842-3.
- Ting, D., et al. (2017) Development and validation of a deep learning system for diabetic retinopathy and related eye diseases using retinal images from multiethnic populations with diabetes. JAMA, 318, pp. 2211–2223. doi.org/10.1001/jama.2017.18152.
- Ardila, D., et al. (2019) End-to-end lung cancer screening with three-dimensional deep learning on low-dose chest computed tomography. Nature Medicine, 25, pp. 954–961. doi.org/10.1038/s41591-019-0447-x.
- Chassagnon, J. G., et al. (2020) Deep learning: definition and perspectives for thoracic imaging. European Radiology, 30, pp. 2021–2030. doi.org/10.1007/s00330-019-06564-3.
- Soffer, S., et al. (2019) Convolutional neural networks for radiologic images: a radiologist’s guide. Radiology, 290, pp. 590–606. doi.org/10.1148/radiol.2018180547.
- Visvikis, D., et al. (2019) Artificial intelligence, machine (deep) learning and radio(geno)mics: definitions and nuclear medicine imaging applications. European Journal of Nuclear Medicine and Molecular Imaging, 46, pp. 2630–2637. doi.org/10.1007/s00259-019-04373-w.
- Zhang, K., et al. (2020) Clinically applicable AI system for accurate diagnosis, quantitative measurements, and prognosis of COVID-19 pneumonia using computed tomography. Cell, 181, pp. 423–1433. doi.org/10.1016/j.cell.2020.04.045.
- Hansell, D. M., et al. (2008) Fleischner Society: glossary of terms for thoracic imaging. Radiology, 246, pp. 697–722. doi.org/10.1148/radiol.2462070712.
- Mei, X., et al. (2020) Artificial intelligence-enabled rapid diagnosis of patients with COVID-19. Nature Medicine, 26, pp. 1224–1228. doi.org/10.1038/s41591-020-0931-3.
- Li, W., et al. (2020) Dense anatomical annotation of slit-lamp images improves the performance of deep learning for the diagnosis of ophthalmic disorders. Nature Biomedical Engineering, 4, pp. 767–777. doi.org/10.1038/s41551-020-0577-y.
- Yasaka, K., et al. (2018) Deep Learning with Convolutional Neural Network for Differentiation of Liver Masses at Dynamic Contrast-enhanced CT: A Preliminary Study. Radiology, 286, pp. 887–896. doi.org/10.1148/radiol.2017170706.
- WHO (2020) Global tuberculosis report. Available at https://apps.who.int/iris/handle/10665/336069.
- Dheda, K., (2016) Tuberculosis. Lancet, 387, pp. 1211–1226.
- Zhou, Z., et al. (2020) Determining the optimal puncture site of CT-guided transthoracic needle aspiration biopsy for the diagnosis of tuberculosis. Journal of Thoracic Disease, doi.org/10.21037/jtd-19-3293.
- Lee, J. H., et al. (2021) Deep learning-based automated detection algorithm for active pulmonary tuberculosis on chest radiographs: diagnostic performance in systematic screening of asymptomatic individuals. European Radiology, 3, pp. 1069–1080. https://doi.org/10.1007/s00330-020-07219-4.
- Kim, W. S., et al. (2006) Pulmonary tuberculosis in infants: radiographic and CT findings. American Journal of Roentgenology, 187, pp. 1024–1033. doi.org/10.2214/ajr.04.0751.
- Ko, J M., et al. (2015) The relation between CT findings and sputum microbiology studies in active pulmonary tuberculosis. European Journal of Radiology, 84, pp. 2339–2344. doi.org/10.1016/j.ejrad.2015.07.032.
- Agrawal, P., et al. (2021) Automated bank cheque verification using image processing and deep learning methods. Multimedia Tools and Applications, 80, pp. 5319–5350. doi.org/10.1007/s11042-020-09818-1.
- Savadjiev, P., et al. (2019) Demystification of AI-driven medical image interpretation: past, present and future. European Radiology, 29, pp. 1616–1624. doi.org/10.1007/s00330-018-5674-x.
- Lakhani P & Sundaram B (2017) Deep learning at chest radiography: automated classification of pulmonary tuberculosis by using convolutional neural networks. Radiology, 284, pp. 574–582. doi.org/10.1148/radiol.2017162326.
- Harmon, S. A., et al. (2020) Artificial intelligence for the detection of COVID-19 pneumonia on chest CT using multinational datasets. Nature Communications, 11, p. 4080. doi.org/10.1038/s41467-020-17971-2.
- Ning, W., et al. (2020) Open resource of clinical data from patients with pneumonia for the prediction of COVID-19 outcomes via deep learning. Nature Biomedical Engineering, 4, pp. 1197–1207. doi.org/10.1038/s41551-020-00633-5.
- Shan, F., et al. (2020) Abnormal lung quantification in chest CT images of COVID-19 patients with deep learning and its application to severity prediction. Medical Physics, 48, pp. 1633–1645. doi.org/10.1002/mp.14609.
- Madaan, V., et al. (2021) XCOVNet: chest X-ray image classification for COVID-19 early detection using convolutional neural networks. New Generation Computing, 24, pp. 1–15. doi.org/10.1007/s00354-021-00121-7.
- Jaeger, P. F., et al. (2018) Retina U-Net: embarrassingly simple exploitation of segmentation supervision for medical object detection. arXiv:1811.08661.
- Li. X., et al. (2020) A deep learning system that generates quantitative CT reports for diagnosing pulmonary Tuberculosis. Applied Intelligence, 51, pp. 4082–4093.