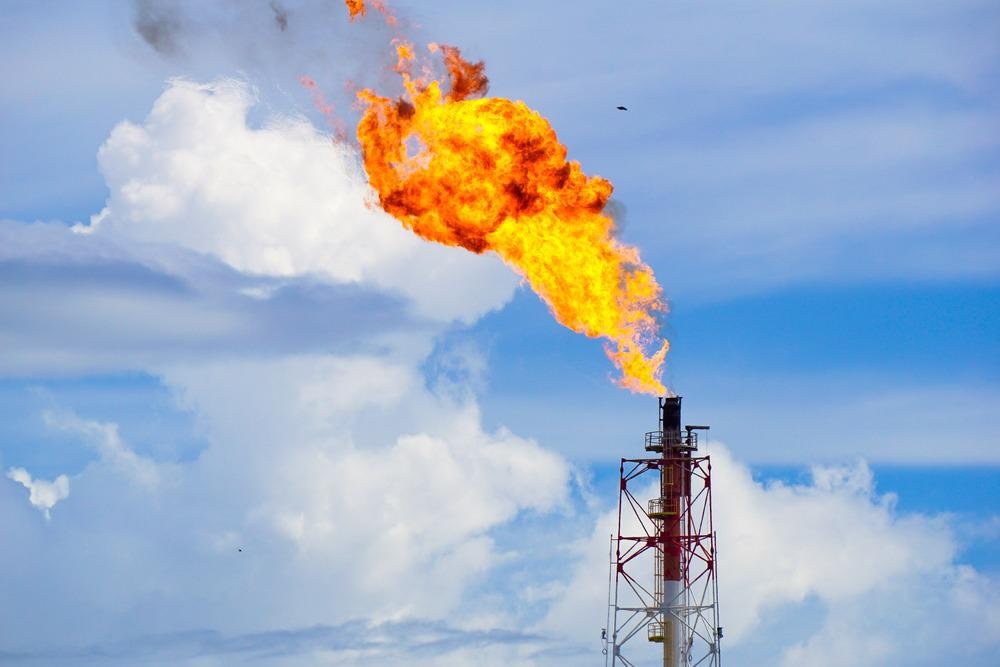
Image Credit: hkhtt hj/Shutterstock.com
Tracking this detrimental greenhouse gas is the responsibility of the Environmental Protection Agency (EPA). The EPA, for assistance, employs computer models capable of taking a “bottom-up” method to calculate the total number of wellheads, miles of pipeline, storage tanks, and other sources of methane and also declares the annual release for every component summing everything. It has been termed an “inventory.”
The only issue is that other organizations that adopt a “top-down” method using the atmospheric measurement or satellite imaging to evaluate the actual total methane emissions comment that the EPA has flaws in marking by almost a half.
Top-down approaches were finding total emissions double the EPA’s estimates, but the reason why was not clear.
Jeff Rutherford, Graduate Student, Stanford University
The new model was developed by Rutherford and his advisor Adam Brandt, professor of energy resources and engineering, which tries to establish a link between the top-down approach and bottom-up methods. . The study was published in the journal Nature Communications.
If our emissions-based models that we use to make important climate-related decisions are not correct, it is a big problem.
Adam Brandt, Director, Natural Gas Initiative, Stanford University
Better Data
Similar to EPA, Rutherford and Brandt adopted a bottom-up method. However, they employed the latest component-level data to formulate the real amount of methane more precisely.
The information utilized in their model was collected by performing direct sampling at several components of the oil and gas industry where methane is likely to escape, such as valves, connectors, storage tanks, and hatches on wellheads.
We use a very similar approach as the EPA, but with different underlying data. The EPA’s inventory and their modeling are actually very good—the best there is. It took me two years of digging through it to understand and try to build on it.
Jeff Rutherford, Graduate Student, Stanford University
The outcomes obtained from the new model nearly approximate the comments of top-down modelers that the present estimates are low. The Brandt and Rutherford model falls within the margin of error of the top-down inventories.
According to Rutherford, an important source of these missing emissions is the liquid storage tanks. Certain emissions are intentional, like the occurrence of “flashing,” where dissolved methane under pressure escapes when there is a decrease in pressure.
“It’s like opening a beer. It’s liquid as long as there is high enough pressure, but if you release the pressure, the gas quickly escapes,” stated Rutherford.
However, most cases occur due to operator error, such as when a technician accidentally leaves a hatch open or the separation equipment malfunctions. The combination of two results in increased emissions from storage tanks, even when the storage is only one component among many, denote the researchers.
The aim is not to replace current models but to offer a beneficial baseline tool based on which previous models can be modified to render future inventories more precise. Rutherford has been discussing the outcomes of the new model and its benefits with state and federal regulators and oil and gas producers.
Rutherford concluded, “It is helpful simply to identify that there is a problem. But, beyond that, our model offers up some clear actionable steps to improve our inventories and ways operators can adjust their practices that could really make a difference in reducing the amount of methane entering the skies.”
Journal Reference:
Rutherford, J. S., et al. (2021) Closing the methane gap in US oil and natural gas production emissions inventories. Nature Communications. doi.org/10.1038/s41467-021-25017-4.