Self-propelling components serve as key building blocks of micro-scale autonomous systems. Such self-propulsion criteria can be fulfilled by the properties of liquid metals.
So far, there has been no research surrounding the impact of electrolyte ionic content around a liquid metal that results in symmetry breaking that creates motion. The study uses the ionic properties of the aqueous electrolyte to demonstrate the controlled actuation of liquid metal droplets.
The researchers demonstrated that pH or ionic concentration gradients across a liquid metal droplet cause surface Marangoni flow as well as deformation. They showed that the deformation controlled by Lippmann’s equation causes the highest velocity for ionic imbalance-induced self-propulsion of liquid metal droplets.
Several major applications were described in this regard, which exploit motions induced by electrolyte. Based on these latest findings, it can be assumed that the propulsion of small systems, which were fully built and regulated with fluids, are advancing towards more sophisticated soft systems.
Methodology
For the experiments shown in Figures 1 to 3, acid and base were dispensed at a uniform flow rate of 200 ml per minute by using a Fusion 720 dual syringe pump. The same were infused at a uniform flow rate of 400 ml per minute using a PHD 2,000 Harvard syringe pump.
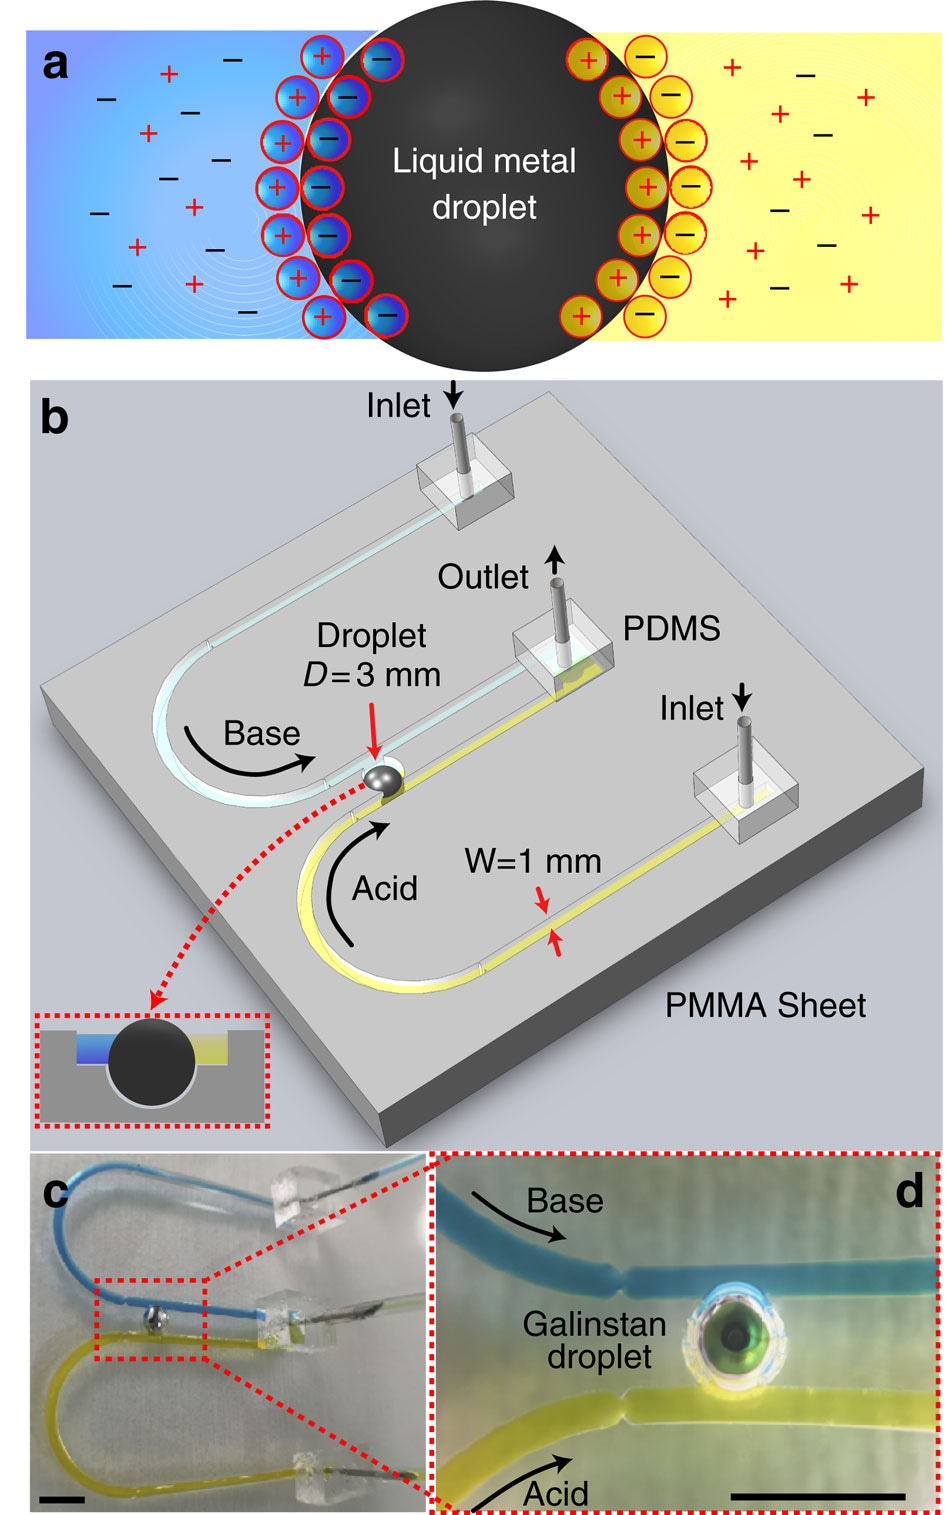
Figure 1. Framework for analyzing liquid metal droplet dynamics under ionic imbalance. (a) Top view schematic of the droplet and arrangement of ions, forming the EDL. (b) Schematic of the experimental setup showing two U-shaped open-top (see inset) polymethyl methacrylate (PMMA) inlet channels, which extend in parallel and join at an outlet. Two channels carry different types of electrolytes represented in distinct colors, acidic in yellow and basic in blue. Two parallel flows come in contact with the Galinstan droplet of 3 mm diameter residing in a recess. (c) Actual experimental set up. (d) Close-up view of c. Scale bars, 5 mm.
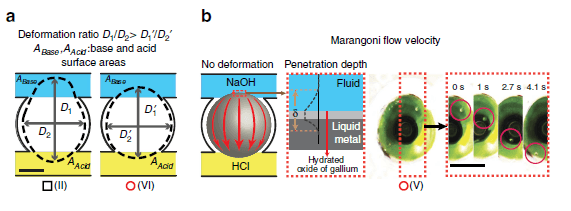
Figure 2. Dynamics of the liquid metal droplets under different HCl and NaOH concentrations. (a) Schematic of the deformation ratio measurements for D1/D2 assessment. ‘Black square’ indicates experiments with deformation dominating the dynamics and Marangoni flow dominant experiments are represented by ‘red circles’. (b) Demonstration of Marangoni flow and sequential snap shots shows a micro particle transferring from NaOH to HCl. The tangential skin flow displaced component, as a result of the Marangoni effect, contains a Galinstan layer near the surface of the droplet, an oxide layer and a layer of electrolyte also near the surface. A thickness of ä is used to define the effective thickness of this layer.
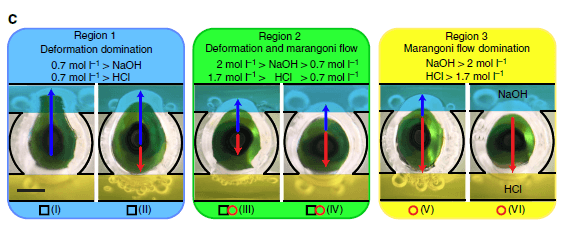
(c) Selected enlarged images showing droplet deformation (in black arrows) towards NaOH, while Marangoni flow (in red arrows) direction is towards HCl.
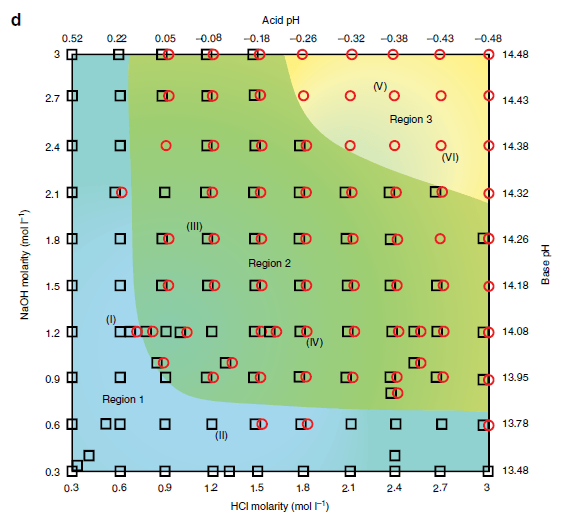
(d) Reference diagram of liquid metal droplet dynamics under a pH imbalance. Each ‘black square’ or ‘red circle’ presents an experiment with measurable deformation ratio or Marangoni flow, respectively (overlapped ‘black square’ and ‘red circle’ indicates experiments with both measurable Marangoni flow and deformation ratios without a distinct dominating effect), in various ionic concentrations of HCl and NaOH between 0.3 and 3 mol l−1 (pH ~0.5 to ~−0.5 for HCl and ~13.5 to ~14.5 for NaOH, respectively). The background of the reference diagram is colored blue, green and yellow accordingly, to represent each of the regions (deformation, deformation–Marangoni and Marangoni regions) discussed in the text. Scale bars, 1 mm.
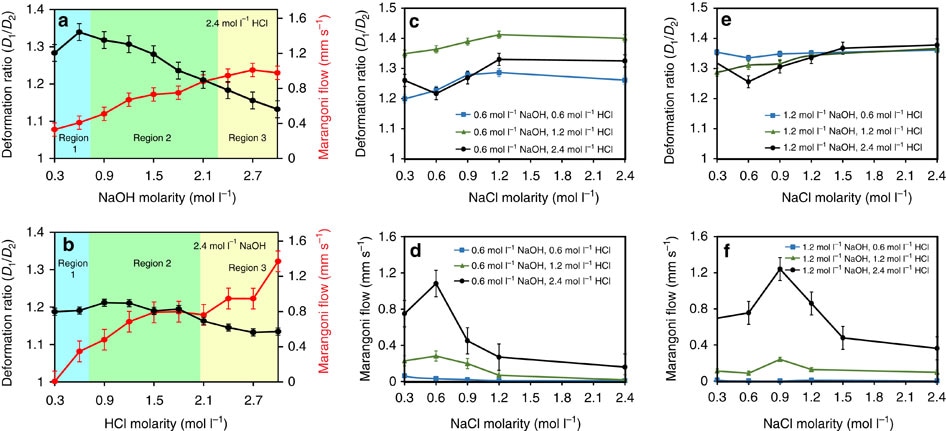
Figure 3. Changes of deformation and Marangoni flow under different conditions. (a) Graph of the experimental measurements with varying NaOH and constant HCl molarities. Error bars are s.e.m. (N=6). (b) Graph of the experimental measurements with varying HCl and constant NaOH molarities. Black and red lines indicate droplet deformation ratio and Marangoni flow rates, respectively. Background colours correspond to regions of the reference diagram in Figure 2c. Error bars are s.e.m. (N=6). (c–f) Graphs present the deformation ratio and Marangoni flow in varying concentrations of NaCl, while concentrations of NaOH and HCl are kept constant. NaCl is mixed with NaOH in all experiments. Error bars are s.e.m. (N=6).
It was assumed that the effect of flow viscosity on the liquid metal droplets is negligible. Control of inlet flow was done through a thin orifice opening, which was designed to prevent any irregularities of inlet flow prior to sweeping through the droplet.
Using an advanced image processing program in Matlab program, video recording was examined to help assess the droplet dynamics. A camera lens was fixed with cone-shaped blue light and ultraviolet wavelength band-pass filters to cover the droplet and reduce the absorption of light energy. Both video recordings and photos showed a green reflection of the surface of the droplet facing towards the camera.
In Figure 4, Teflon was used to coat the recess and its walls to create a hydrophobic surface. Hydrophobicity ensures that the intermediate surface is not wetted by ionic solutions. These solutions function as an electrical conductor, bypassing the EDL capacitor.
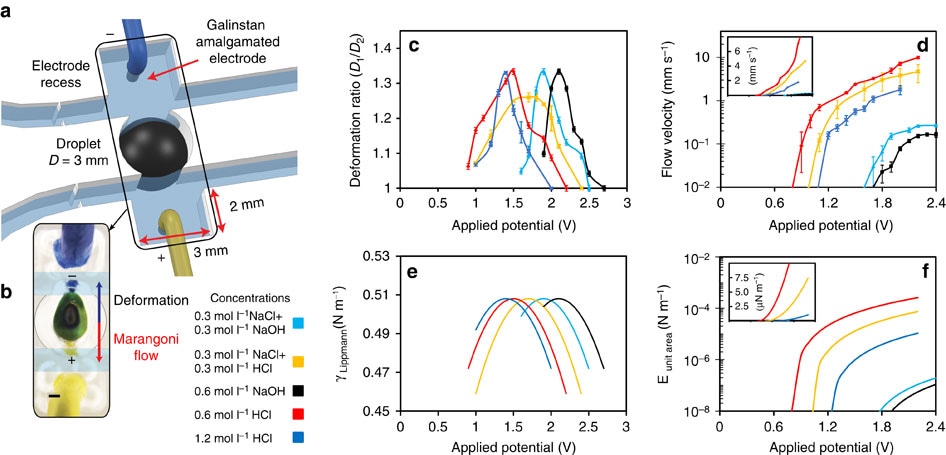
Figure 4. Characterization of droplet dynamics with an external applied electrical potential. (a) Electrodes are covered with Galinstan and placed in rectangular recesses. (b) Marangoni flow and deformation direction of droplet created by the electrical potential. Scale bar, 0.5 cm. (c) Deformation ratios under the applied electrical potential. Error bars indicate s.e.m. (N=6). (d) Marangoni flow velocities under the applied electrical potential. Applied potentials that are greater than presented here cause the oxidation of the liquid metal. Error bars indicate s.e.m. (N=6). Calculated: (e) surface tension of the Galinstan droplet using Lippmann’s equation (PZC value for EGaIn has been used in the simulation as the PZC of Galinstan1 and (f) the kinetic energies of Marangoni flows per unit area of a surface’s cross-section. Insets in d and f show graphs in linear scales.
Galinstan was used to amalgamate copper electrode tips to prevent the creation of battery cells in between the electrodes and droplet. Both channels were fully separated, ensuring that reduced voltage only occurs on the liquid metal droplet. Within individual channels, the electrolyte levels were similar but lower than that of the droplet surface.
In Figure 5, a milling machine was used to cut a perfluoroalkoxy tube in half to form a semi-cylindrical channel. Following this, a dry-film Teflon spray was used to coat the perfluoroalkoxy semi-cut tube to reduce the friction force and improve the droplet’s movement. 9 ml of solution was added to each reservoir.
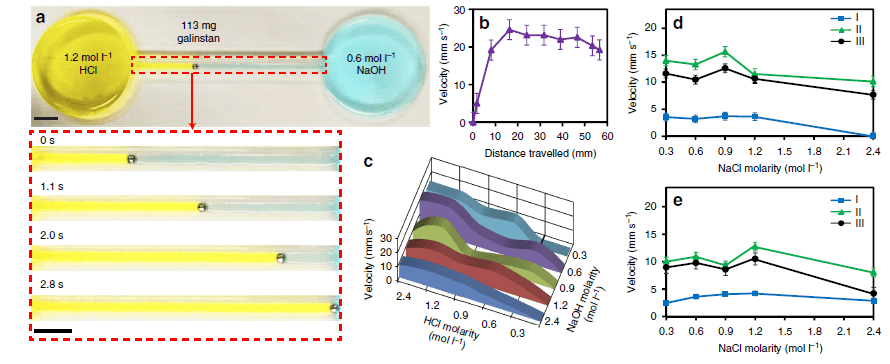
Figure 5. Liquid metal self-propulsion. (a) Droplet propels from 1.2 mol l−1 HCl to 0.6 mol l−1 NaOH reservoir. (b) The instantaneous droplet velocity profile of experiment a. Error bars indicate the s.e.m. (N=2). (c) Average velocity of droplets under different acidic and basic solutions. (d,e) Droplet velocities at different NaCl concentrations. Error bars indicate the s.e.m. (N=3). I, II, III in d indicate constant 0.6mol l−1 NaOH (pH ~13.8) and 0.6, 1.2 and 2.4mol l−1 HCl (pH 0.2, ~−0.1 and ~−0.4), respectively. I, II, III in e indicate constant 1.2 mol l−1 NaOH (pH ~14.1) and 0.6, 1.2 and 2.4 mol l−1 HCl (pH ~0.2, ~−0.1 and ~−0.4), respectively.
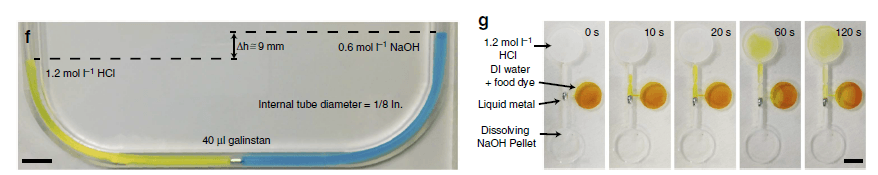
(f) Metal droplet pushes the liquid to produce a 6.5mm difference in height. According to the ñgh (in which ñ is the density, g is the gravitation acceleration constant and h is the liquid height), this amount of liquid equates to a pressure exceeding ~1 mbar for 1/8-inch diameter tubing. By reducing the area, this headpressure can be significantly increased. (g) The concept of a switch based on the motion induced by the electrolyte difference on either side of the droplet. The pH difference across the liquid metal droplet induces a motion towards the basic liquid and opens the inlet to the liquid with DI water/yellow dye after 10s. The liquid in the middle reservoir then mixes with the acidified liquid in the top reservoir. Snapshots taken at: 0, 10, 20, 60 and 120 seconds. Scale bars, 1 cm.
Galinstan liquid metal (113 mg) was then divided into two tinier droplets and located within the channel, and each droplet was subsequently joined to each reservoir. The droplets were combined together and their separation reduced the mixing of ionic solutions at the beginning of the experiments.
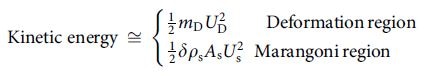
The researchers observed that the stored energy on the droplet surface - due to ionic imbalance - can be changed into:
- Tangential skin flow for high concentrations electrolytes in the Marangoni region (or)
- Droplet propulsion kinetic energy for electrolytes of low concentrations in the deformation region
An additional term is involved in every component, denoting the loss of viscosity (flow viscosity loss for the Marangoni region and propulsion viscosity loss for the deformation region). If these viscosity loss components are overlooked, then the equation illustrating the system can be simplified as follows:
In short, the study provided an in-depth analysis of the autonomous movement of liquid metal droplets induced by changing the liquid electrolyte that surround the liquid metal. In accordance with Lippmann’s equation, the highest velocity was achieved at the largest extent of induced surface tension gradient.
The electrolytes’ ionic properties have adequate amount of energy to promote the movement of metal droplets by changing the EDL. As a result, the liquid metal droplet is constantly propelled without applying an external electric potential.
The researchers also demonstrated the measurements, which revealed certain optimum conditions for acquiring the highest velocities of liquid metal droplets in an electrolyte-based system. The team also described the system’s pumping and switching capabilities to present certain applications of this electrolyte-based liquid metal motion
The study demonstrates the controlling factors to gain the most optimum condition for self-propulsion criteria, which can also be applied to voltage-induced motion systems.
The results of this study can be exploited for making next-generation low-dimensional, autonomous micromechanical units based on compositional changes of the electrolytes. This way, the use of systems containing only liquid components can be fully exploited.
Liquid metals propel future electronics | RMIT University
Video Source: RMIT University/Youtube.com
Reference:
1 Khan, M. R., Eaker, C. B., Bowden, E. F. & Dickey, M. D. Giant and switchable surface activity of liquid metal via surface oxidation. Proc. Natl Acad. Sci. USA 111, 14047–14051 (2014).
Source:
Nature.com - Zavabeti, A. et al. Ionic imbalance induced self-propulsion of liquid metals. Nat. Commun. 7:12402 doi: 10.1038/ncomms12402 (2016).