Gillnets positioned at various levels of the water column, telemetry, environmental DNA, and hydroacoustic have all been utilized to determine the vertical distribution of fish in reservoirs. These tools enable significant advancements in aquatic ecology, but they have biases and limits like any other instrument. Small Remotely Operated Vehicles (ROVs) are yet to be thoroughly tested in reservoirs as a technique for simultaneously capturing both abiotic and biotic data.
ROVs are submersible robotic devices that can be controlled in real-time from the surface. Each ROV has its own technical characteristics depending on the manufacturer and the intended usage, with a wide range of power, autonomy, depth, attachments, and price.
However, this equipment consists of a camera set in an impermeable container with propellers for maneuvering, which is connected to a cable on the surface that transmits video and telemetry information. Underwater drones are small ROVs that weigh between −3 and 20 kg. The use of ROVs for non-destructive fish visual surveys is a fast-expanding field.
The study's primary goal is to offer a new method for visually surveying freshwater reservoirs using underwater drones (small ROV class) for environmental data and fish cataloging.
Researchers also detail the benefits, drawbacks, and restrictions of using underwater drones in reservoirs for the first time. The hope is that these results will contribute to improved understanding of the processes that control fish distribution in changing settings as well as the development of this innovative non-invasive technology for inland water environmental monitoring.
Methodology
Figure 1 illustrates how the transects followed the margin slope, starting in the profundal zone and climbing in a zigzag pattern to the littoral zone.
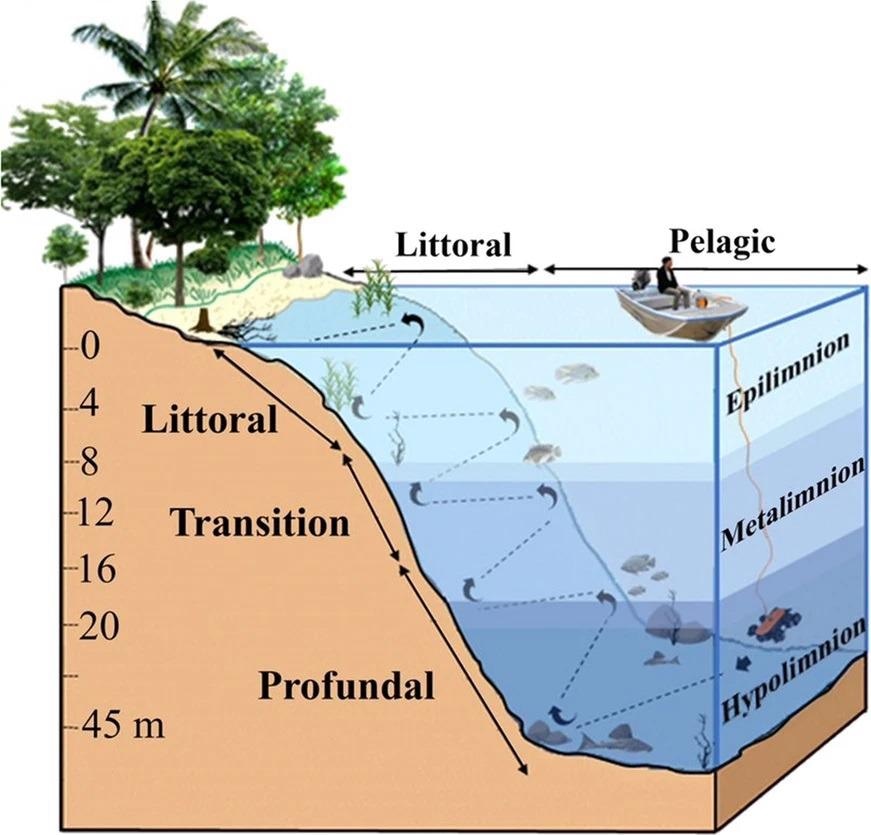
Figure 1. Schematic model showing the dimensions and limits (in meters) of the zones along the steep slopes (littoral, transition and profundal), physicochemical water stratification column (eplimnion, metalimnion and hypolimnion) of the Lajes Reservoir during the summer. Image Credit: Guedes and Araújoal, 2022
Figure 2 shows how the operation was carried out from a boat by two personnel, one in charge of video and the other in the care of the cables.
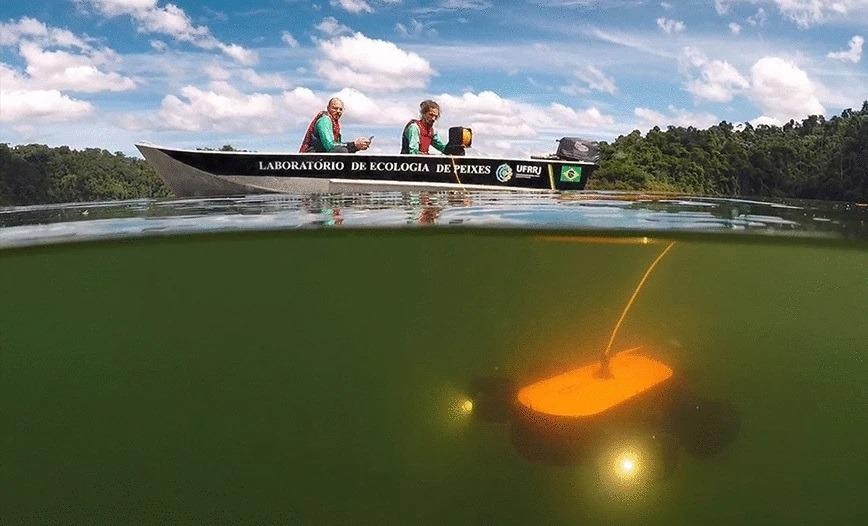
Figure 2. Remotely operated vehicle model Genneino T1 being operated from a boat in the Lajes Reservoir, Rio de Janeiro State, Brazil. Image Credit: Guedes and Araújoal, 2022
Results
PERMANOVA (P = 128.8, P <0.001) revealed significant variations in environmental variables (physicochemical + habitat) across the vertical zones, but no significant differences in periods (day vs. night) or interactions zone vs. period (Table 1).
Table 1. Results of two-way ANOVA on aligned ranks transformation (Anova ART) and the permutational analysis of variance (PERMANOVA) comparing the environmental variables between the vertical zones and periods. Source: Guedes and Araújoal, 2022
| Anova ART |
Zone |
Period |
Zone × Period |
Post-hoc test |
| Temperature (°C) |
275.2*** |
3.12 |
4.2 |
Lit > Tra > Pro |
| Dissolved oxygen (mg/L) |
488.1*** |
3.63 |
10.7*** |
Lit > Tra > Pro |
| Depth (m) |
981.1*** |
7.2** |
0.4 |
Lit < Tra < Pro |
| Leaves (%) |
48.1*** |
0.7 |
1.11 |
Lit = Tra > Pro |
| Branchs (%) |
80.2*** |
4.6 |
7.4** |
Lit > Tra > Pro |
| Clay (%) |
0.5 |
1.5 |
1.1 |
Lit = Tra > Pro |
| Rocks (%) |
17.5*** |
0.9 |
2.2 |
Lit = Tra > Pro |
| PERMANOVA |
Df |
Pseudo-F |
R2 |
|
| Zone |
2 |
128.8 *** |
0.49 |
Lit ≠ Tra ≠ Pro |
| Period |
1 |
1.6 |
> 0.01 |
|
| Zone x Period |
2 |
2.19 |
> 0.01 |
|
| Residuals |
254 |
|
0.49 |
|
| Total |
259 |
|
1 |
|
**p < 0.01, ***p < 0.001
The first PCA axis (57.6% of the explained variation, Figure 3) illustrated the environmental variations between the different vertical zones.
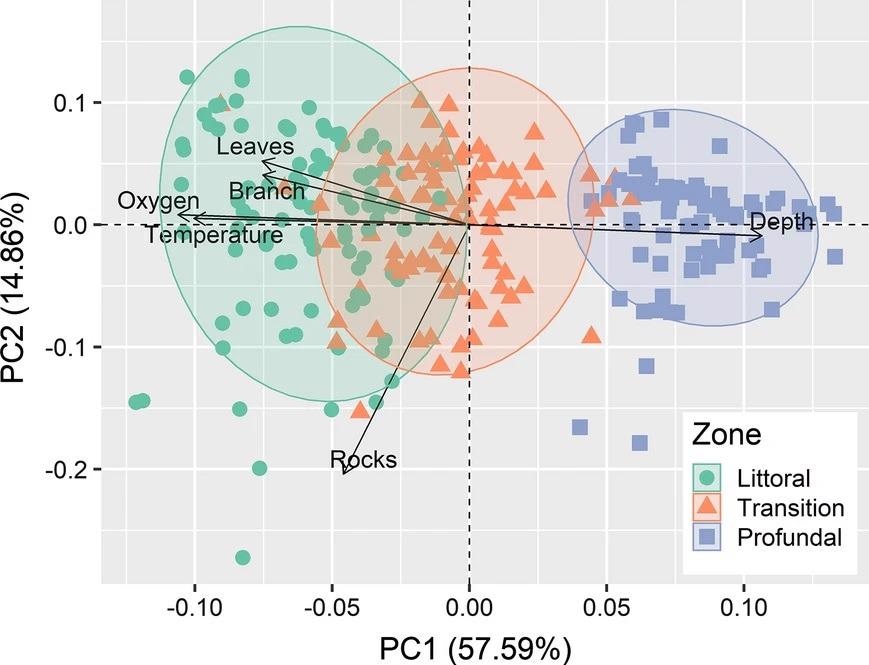
Figure 3. Ordination diagram from the two first axes of principal component analysis (PCA) on environmental variables in the three zones of the steep slope margins of the Lajes Reservoir, Brazil. Image Credit: Guedes and Araújoal, 2022
A total of 442 specimens were found, divided into five orders, six families, and 12 species (Figure 4 and 5).
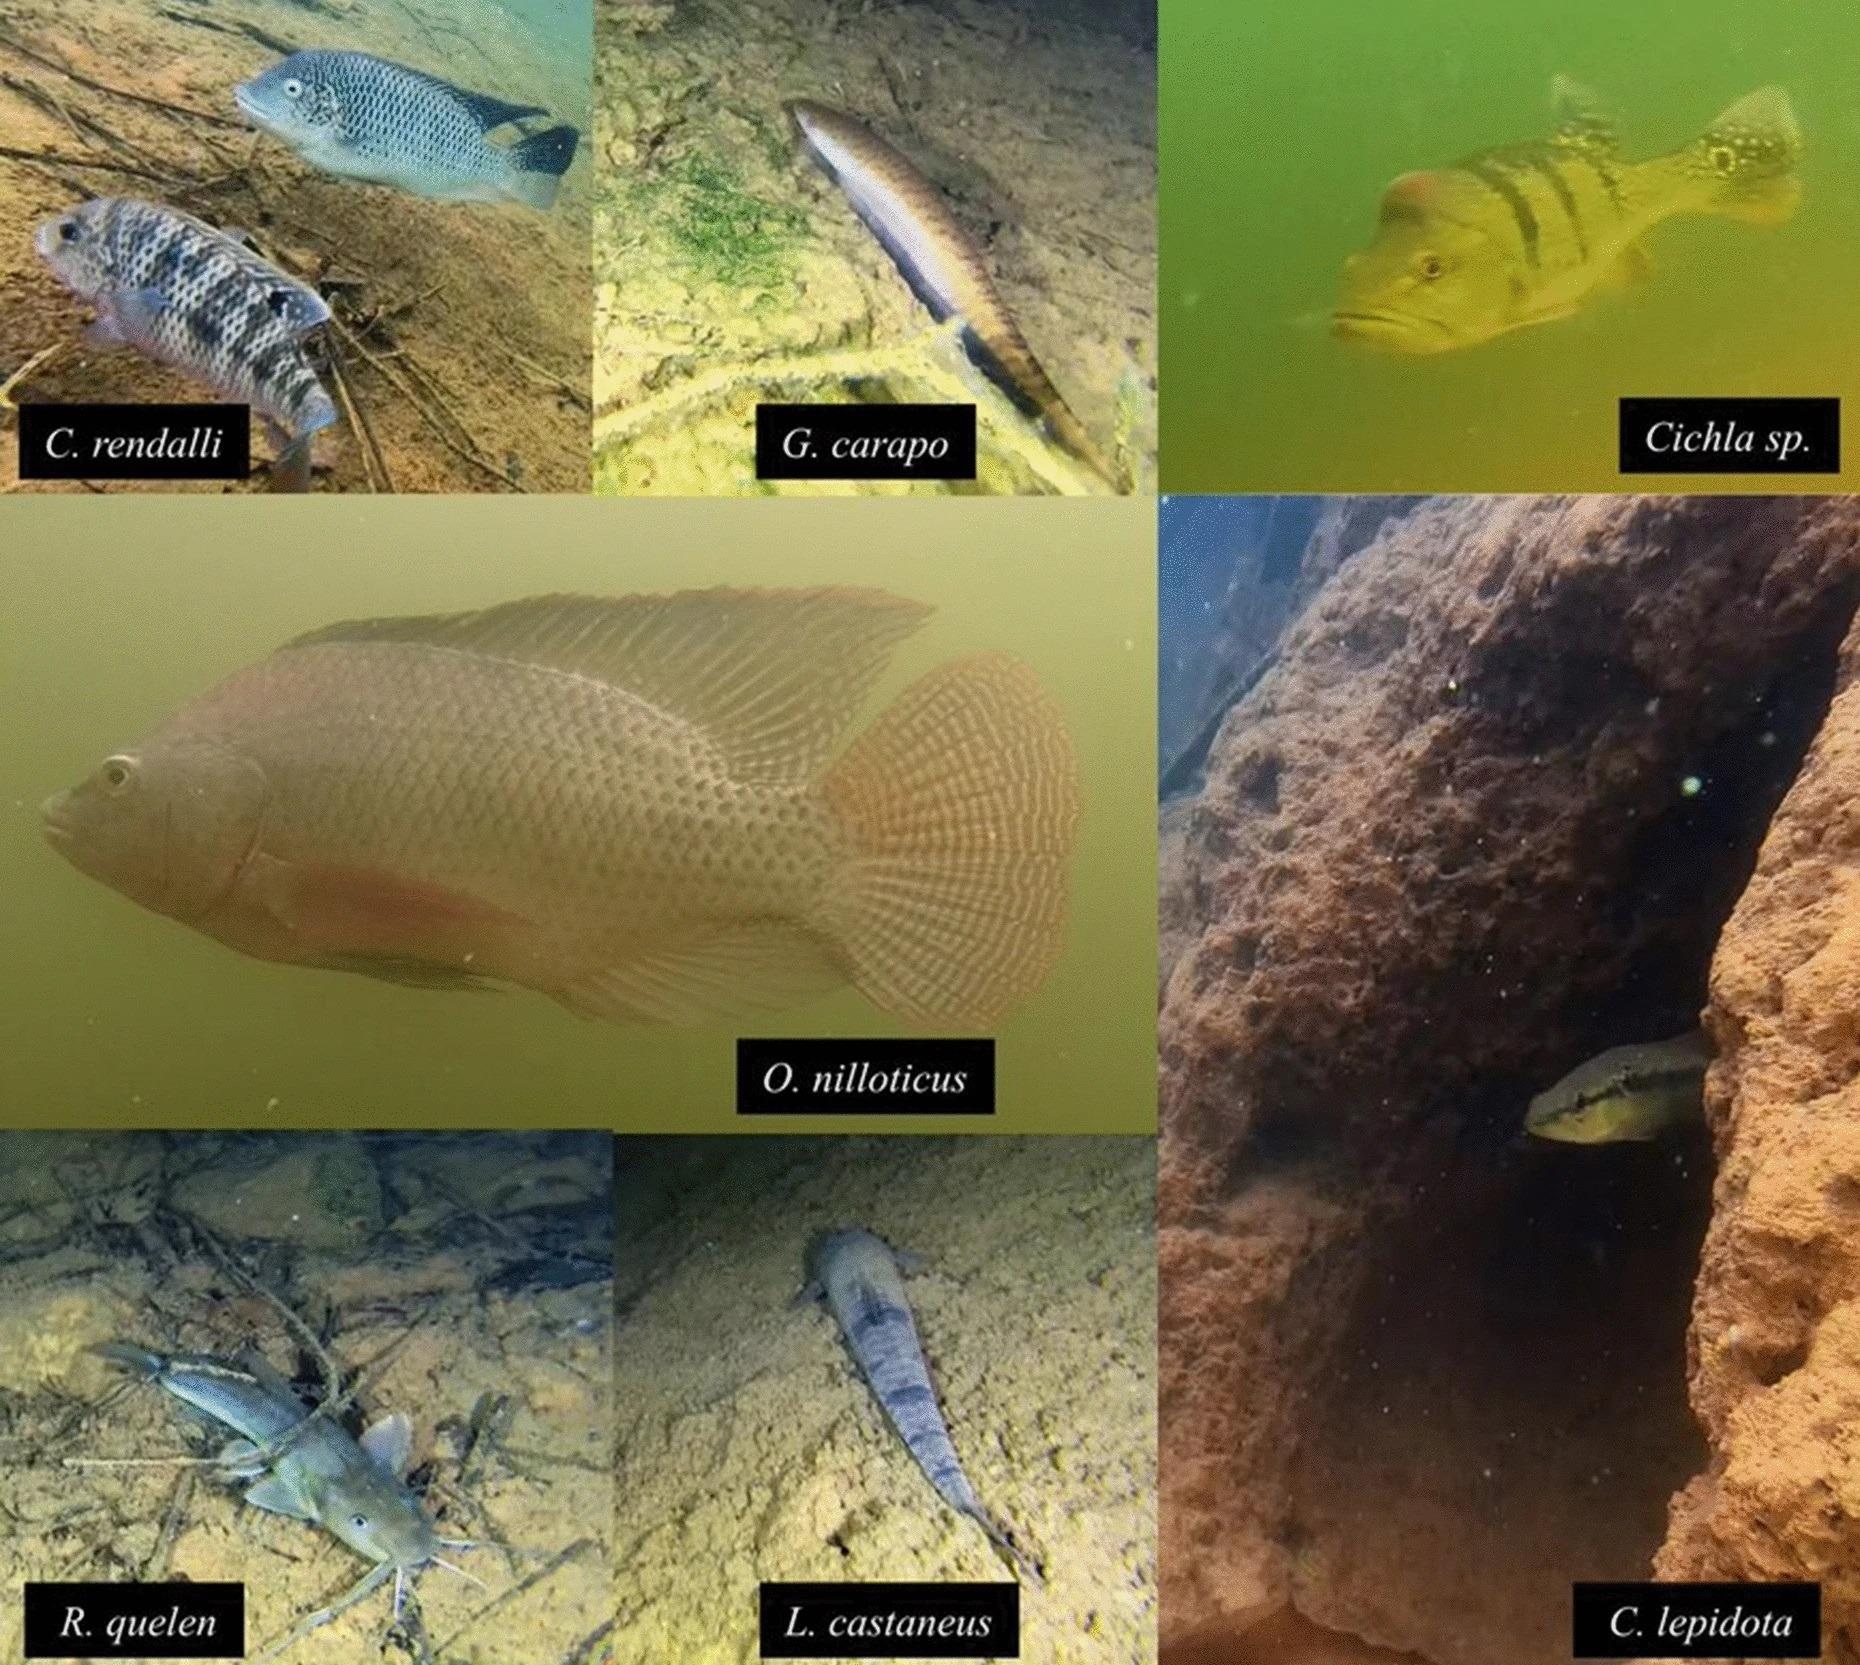
Figure 4. Photographic records of different species of fish produced by the underwater drones in the Lajes Reservoir, Rio de Janeiro State, Brazil. Image Credit: Guedes and Araújoal, 2022
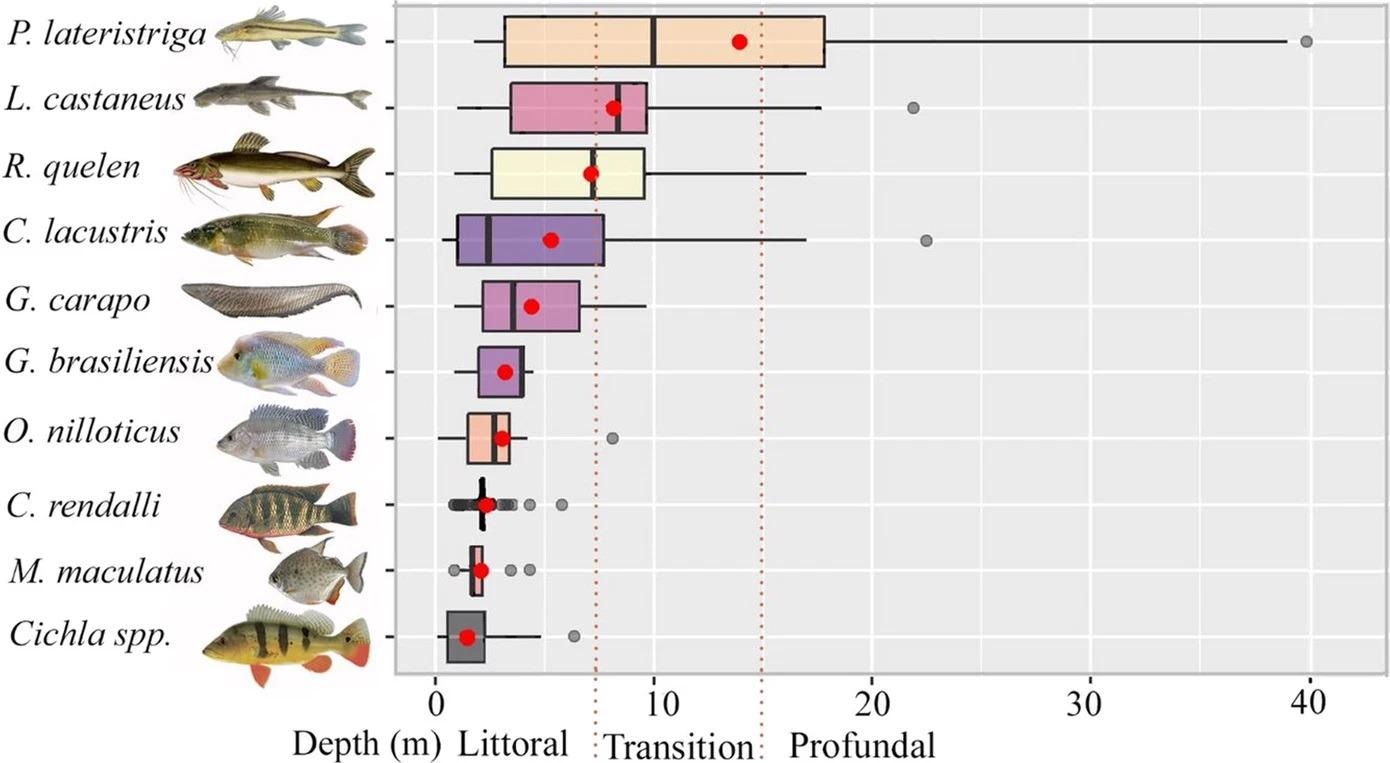
Figure 5. Boxplots of fish occurrence in different vertical zones (m) along the steep slopes of the Lajes Reservoir. Red circles indicate the mean depth of the occurrences. Only species with relative abundance > 3% of the total number of fish were plotted. Image Credit: Guedes and Araújoal, 2022
Vertical zones (PERMANOVA, F = 25.5; P <0.001) and periods (P = 4.7; P <0.01, Table 2) showed differences in the fish assemblage structure.
Table 2. Results of PERMANOVA for comparing differences in the fish assemblage structure between the three vertical zones and two periods. Source: Guedes and Araújoal, 2022
| Source |
df |
MS |
Pseudo- F |
R2 |
| Zone |
2 |
2.33 |
25.54*** |
0.16 |
| Period |
1 |
0.43 |
4.74** |
0.015 |
| Zone × period |
2 |
0.18 |
2.06 |
0.013 |
| Residuals |
254 |
0.09 |
|
0.8 |
| Total |
259 |
|
|
|
| Pair wise test for the fixed factors |
| Zone |
t |
|
Period |
t |
| Littoral × transition |
28.0*** |
|
Day × Night |
4.02** |
| Littoral × profundal |
31.1*** |
|
|
|
| Transition × profundal |
1.52 |
|
|
|
df degree of freedom, MS Mean square; R2 coefficient of determination
Figure 6 illustrates that species richness was expected to be the highest in the littoral, followed by transition and profundal zones, based on extrapolated species diversity based on Hill numbers (q = 0).
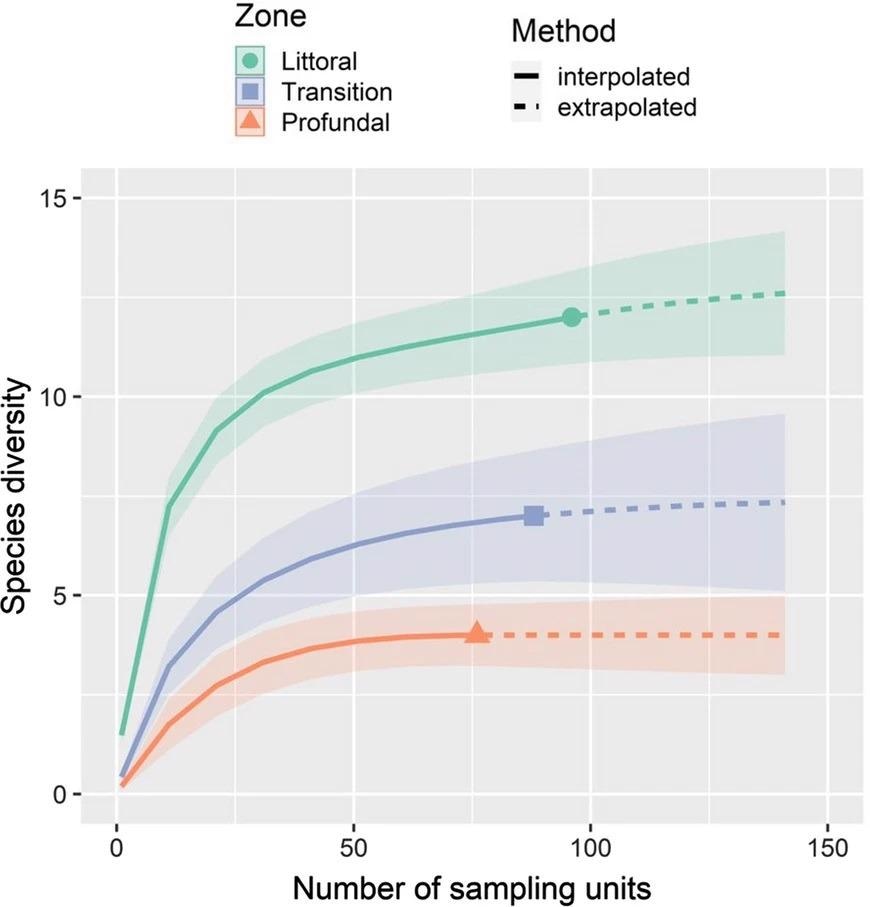
Figure 6. Rarefaction/extrapolation (R/E) of fish species performed with iNEXT for the studied zones of the Lajes Reservoir, with 95% confidence intervals. Image Credit Guedes and Araújoal, 2022
Discussion
While using ROVs, researchers must first examine the equipment's particular impacts, such as varying light intensities and artificial noise, as well as the vehicle's speed, size, and depth of operation. The fish in the Lajes Reservoir react differently to the presence of the mini ROV, with some ignoring it while others appear to be drawn to it.
The fish assemblages recorded with the ROV differed significantly from those previously observed using gillnets in the Lajes Reservoir. The performance of video transects with ROV can be facilitated by hydro-environmental factors and prior knowledge of the reservoir ichthyofauna.
Introducing small, low-cost ROVs (starting at roughly $3,000) has made environmental monitoring more accessible. Other attachments, like suction samplers for benthic fauna, robotic arms, optical systems, sonar to measure zooplankton, and hydrophones, make the ROV a versatile instrument that may complement or even replace traditional means of gathering environmental data.
The profundal zone has a less organized fish assemblage, with a focus on the presence of P. lateristriga, a shallow-water native species that was unexpectedly found exploring the deep reservoir sections (at a depth of 38 m). This study reveals a diverse range of species' occupancy on the steep slopes of the Lajes reservoir, as well as the lack of fully unoccupied habitats.
As a result, fish use the reservoir littoral zone more for spawning, feeding, and refuge, resulting in greater fish quantity and diversity. The causes for fish migration to littoral zones at night are largely unclear. However, resting, bioenergetic efficiency, food chances, and predator avoidance appear to be the primary reasons. Changes in species richness during the diurnal cycle are eventually influenced by these variables.
Conclusion
Researchers are the first to propose using tiny ROVs to monitor fish in reservoirs. Along the steep slopes of the reservoir, researchers discovered a vertical gradient in environmental parameters, as well as different fish assemblage patterns. Scientists found that in the littoral zone, there was a higher quantity and diversity of fish, which was linked to increased environmental variability.
The biases, problems, and potential of using ROV in freshwater systems were also highlighted. Due to the prevalence of lentic circumstances, great water transparency (up to 6 m—Secchi's Disc), and substantial existing information of the ichthyofauna, the Lajes Reservoir appeared to be an appropriate case study.
The lack of research using ROVs in inland seas, in general, continues to obstruct the development of reliable procedures, protocols, and comparisons. This chasm is what makes this method so the potential for freshwater discussions and discoveries. Underwater drones can be a useful environmental instrument for collecting abiotic and biotic data at the same time, especially in deep reservoirs with a variety of ecosystems, leading in improvements in environmental monitoring.
Journal Reference
Guedes, G. H. S., & Araújo, F. G. (2022). Underwater drones reveal different fish community structures on the steep slopes of a tropical reservoir. Hydrobiologia, pp. 1–12. Available Online: https://link.springer.com/article/10.1007/s10750-021-04790-9.
References and Further Reading
- Agostinho, A. A., et al. (1999) Patterns of colonization in neotropical reservoirs and prognoses on aging. In: Tundisi, J. G. & M. Straskraba (eds), Theoretical reservoir ecology and its applications. Backhuys Publishers, São Carlos.
- Agostinho, A. A., et al. (2007) Ecology and Management of Fishery Resources in Reservoirs in Brazil. EDUEM, Maringá. (in portuguese).
- Agostinho, A. A., et al. (2008) Dams and the fish fauna of the Neotropical region: impacts and management related to diversity and fisheries. Brazilian Journal of Biology, 68, pp. 1119–1132. doi.org/10.1590/S1519-69842008000500019.
- Agostinho, A. A., et al. (2016) Fish assemblages in Neotropical reservoirs: colonization patterns, impacts and management. Fisheries Research, 173, pp. 26–36. doi.org/10.1016/j.fishres.2015.04.006.
- Alin, S. A., et al. (1999) Effects of Landscape Disturbance on Animal Communities in Lake Tanganyika, East Africa. Conservation Biology,13, pp. 1017–1033. doi.org/10.1046/j.1523-1739.1999.96476.x.
- Araújo, F G & Santos, L N (2001) Distribution of fish assemblages in the Lajes Reservoir, Rio de Janeiro. Brazilian Journal of Biology, 61, pp. 563–576. doi.org/10.1590/S1519-69842001000400006.
- Araújo, F. G., et al. (2021) Assessment of changes in the ichthyofauna in a tropical reservoir in south-eastern Brazil: consequences of global warming? Ecology of Freshwater Fish Early View. doi.org/10.1111/eff.12607.
- Baumgartner, M. T., et al. (2018) Spatial and temporal variations in fish assemblage: testing the zonation concept in small reservoirs. Brazilian Journal of Biology, 78, pp. 487–500. doi.org/10.1590/1519-6984.170424.
- Blabolil, P., et al. (2021) Environmental DNA metabarcoding uncovers environmental correlates of fish communities in spatially heterogeneous freshwater habitats. Ecological Indicators, 126, p. 107698. doi.org/10.1016/j.ecolind.2021.107698.
- Borcard, D., et al. 2011. Numerical Ecology with R, Springer, New York.
- Branco, C. W. C., et al. (2009) Impact of climate on the vertical water column structure of Lajes Reservoir (Brazil): a tropical reservoir case. Lakes & Reservoirs: Research & Management, 14, pp. 175–191. doi.org/10.1111/j.1440-1770.2009.00403.x.
- Brazilian Committee of Dams, 2011. The History of Dams in Brazil, Centuries XIX, XX and XXI: Fifty Years of the Brazilian Committee of Dams, CBB, Rio de Janeiro:
- Brosse, S., et al. (2007) Fish assemblage patterns in the littoral zone of a European reservoir. Freshwater Biology, 52, pp. 448–458. doi.org/10.1111/j.1365-2427.2006.01704.x.
- Busch, S & Mehner, T (2009) Hydroacoustic estimates of fish population depths and densities at increasingly longer time scales. International Review of Hydrobiology, 94, pp. 91–102. doi.org/10.1002/iroh.200811092.
- Cáceres, M & Legendre, P (2009) Associations between species and groups of sites: indices and statistical inference. Ecology, 90, pp. 3566–3574. doi.org/10.1890/08-1823.1.
- Carleton, K (2009) Cichlid fish visual systems: mechanisms of spectral tuning. Integrative Zoology, 4, pp. 75–86. doi.org/10.1111/j.1749-4877.2008.00137.x.
- Čech, M., et al. (2005) Diel vertical migrations of bathypelagic perch fry. Journal of Fish Biology, 66, pp. 685–702. doi.org/10.1111/j.0022-1112.2005.00630.x.
- Clarke, K. R., et al. (2006) On resemblance measures for ecological studies, including taxonomic dissimilarities and a zero-adjusted Bray-Curtis coefficient for denuded assemblages. Journal of Experimental Marine Biology and Ecology, 330, pp. 55–80. doi.org/10.1016/j.jembe.2005.12.017.
- Dias, R. M., et al. (2021) Functional erosion and trait loss in fish assemblages from neotropical reservoirs: the man beyond the environment. Fish and Fisheries, 22, pp. 377–390. doi.org/10.1111/faf.12524.
- Fernando, C H & Holčík, J (1991) Fish in reservoirs. International Review in Hydrobiology, 76, pp. 149–167.
- Gido, K. B., et al. (2009) Convergence of fish communities from the littoral zone of reservoirs. Freshwater Biology, 54, pp. 1163–1177. doi.org/10.1111/j.1365-2427.2008.02162.x.
- Gois, K. S., et al. (2012) The role of submerged trees in structuring fish assemblages in reservoirs: two case studies in South America. Hydrobiologia, 685, pp. 109–119. doi.org/10.1007/s10750-011-0843-9.
- Goulon, S., et al. (2018) Complementarity of two high-resolution spatiotemporal methods (hydroacoustics and acoustic telemetry) for assessing fish distribution in a reservoir. Hydroécologie Appliquée. 20, pp. 57–84.
- Guedes, G. H. S., et al. (2020) Artificial flow regime promotes abiotic and biotic gradients: testing the concept of longitudinal zonation in an off-river reservoir. Ecohydrology & Hydrobiology, 20, pp. 256–264. doi.org/10.1016/j.ecohyd.2020.02.002.
- Guedes, G. H. S., et al. (2021) Equilibrium reproductive strategy of the peacock bass Cichla kelberi facilitates invasion into a Neotropical reservoir. Journal of Fish Biology, 98, pp. 743–755. doi.org/10.1111/jfb.14618.
- Hamley, J M (1975). Review of gillnet selectivity. Journal of the Fisheries Board of Canada, 32, pp. 1943–1969. doi.org/10.1139/f75-233.
- Hsieh, T. C., et al. (2016) iNEXT: an R package for interpolation and extrapolation of species diversity (Hill numbers). Methods in Ecology and Evolution, 7, pp. 1451–1456. doi.org/10.1111/2041-210X.12613.
- Kay, M & Wobbrock J (2020) ARTool: Aligned Rank Transform for Nonparametric Factorial ANOVAs. doi.org/10.5281/zenodo.594511.
- Klippel, G., et al. (2020) Comparison of different trophic state indices applied to tropical reservoirs. Lakes & Reservoirs: Research and Management, 25, pp. 214–229. doi.org/10.1111/lre.12320.
- Kubečka, J. E., et al. (2009) The true picture of a lake or reservoir fish stock: a review of needs and progress. Fisheries Research, 96, pp. 1–5.
- Lewis, V M (2009) Ecological zonation in lakes. In Likens, G. (ed), Encyclopedia of Inland Waters. Elsevier, Oxford.
- Lima, R., et al. (2020) Innovative water quality and ecology monitoring using underwater unmanned vehicles: field applications, challenges and feedback from water managers. Water, 12, p. 1196. doi.org/10.3390/w12041196.
- Lucas, M C & Baras, E (2000) Methods for studying spatial behavior of freshwater fishes in the natural environment. Fish and Fisheries, 1, pp. 283–316. doi.org/10.1046/j.1467-2979.2000.00028.x.
- Matthews, W J (1998). Patterns in freshwater fish ecology, Chapman and Hall, New York.
- McLean, D. L., et al. (2020) Enhancing the scientific value of industry Remotely Operated Vehicles (ROVs) in our oceans. Frontiers in Marine Science, 7, pp. 1–20. doi.org/10.3389/fmars.2020.00220.
- McMeans, B. C., et al. (2020) Winter in water: differential responses and the maintenance of biodiversity. Ecology Letters, 23, pp. 922–938. doi.org/10.1111/ele.13504.
- Mehner, T (2012) Diel vertical migration of freshwater fishes – proximate triggers, ultimate causes and research perspectives. Freshwater Biology, 57, pp. 1342–1359. doi.org/10.1111/j.1365-2427.2012.02811.x.
- Monk, J., et al. (2020) Field manual for imagery-based surveys using remotely operated vehicles (ROVs). In: Przeslawski, R., Foster, S. (eds.), Field Manuals for Marine Sampling to Monitor Australian Waters. National Environmental Science Programme (NESP). https://rov-field-manual.github.io/.
- Murrie, A., et al. (2014) heory and standards. In Christ, R. D. & R. L. Wernli (eds), The ROV Manual: A User Guide for Remotely Operated Vehicles. Butterworth, Heinemann.
- Muška, M., et al. (2018) Real-time distribution of pelagic fish: combining hydroacoustics, GIS and spatial modelling at a fine spatial scale. Scientific Reports, 8, p. 5381. doi.org/10.1038/s41598-018-23762-z.
- Muška, M., et al. (2013) To migrate, or not to migrate: partial diel horizontal migration of fish in a temperate freshwater reservoir. Hydrobiologia, 707, pp. 17–28. doi.org/10.1007/s10750-012-1401-9.
- Oksanen, J., et al. (2019) Vegan: Community Ecology Package. R package version 2.5–6. https://CRAN.R-project.org/package=vegan.
- Oliveira, A. G., et al. (2014) Implications of using a variety of fishing strategies and sampling techniques across different biotopes to determine fish species composition and diversity. Natureza & Conservação, 12, pp. 112–117. doi.org/10.1016/j.ncon.2014.08.004.
- Oliveira, E F & Goulart, E (2008). Distribuição espacial de peixes em ambientes lênticos: interação de fatores. Acta Scientiarum: Biological Sciences, 22, pp. 445–453.
- Pelicice, F M & Agostinho, A A (2009) Fish fauna destruction after the introduction of a non-native predator (Cichla kelberi) in a Neotropical reservoir. Biological Invasions, 11, pp. 1789–1801. doi.org/10.1007/s10530-008-9358-3.
- Pollock, M. S., et al. (2007) The effects of hypoxia on fishes: From ecological relevance to physiological effects. Environmental Reviews, 15, pp. 1–14. doi.org/10.1139/a06-006.
- Pollom, R A & Rose, G A (2016) A global review of the spatial, taxonomic, and temporal scope of freshwater fisheries hydroacoustics research. Environmental Reviews, 24, pp. 333–347. doi.org/10.1139/er-2016-0017.
- Prchalová, M., et al. (2008) Distribution patterns of fishes in a canyon-shaped reservoir. Journal of Fish Biology, 73, pp. 54–78. doi.org/10.1111/j.1095-8649.2008.01906.x.
- R Core Team. 2020. R: A language and environment for statistical computing. R Foundation for Statistical Computing, Vienna, Austria. https://www.R-project.org/.
- Říha, M., et al. (2015) Patterns in diel habitat use of fish covering the littoral and pelagic zones in a reservoir. Hydrobiologia, 747, pp. 111–131. doi.org/10.1007/s10750-014-2124-x.
- Ryer, C. H., et al. (2009) Effects of simulated underwater vehicle lighting on fish behavior. Marine Ecology Progress Series, 391, pp. 97–106. doi.org/10.3354/meps08168.
- Santos, A. B., et al. (2014) Peixes do Reservatório de Lajes, Wall Print, Rio de Janeiro.
- Sharpe, D. M. T., et al. (2017) Tropical fish community does not recover 45 years after predator introduction. Ecology, 98, pp. 412–424. doi.org/10.1002/ecy.1648.
- Soares, M. C. S., et al. (2008) The effects of water retention time and watershed features on the limnology of two tropical reservoirs in Brazil. Lakes & Reservoirs: Research and Management, 13, pp. 257–269. doi.org/10.1111/j.1440-1770.2008.00379.x.
- Straškraba, M & Tundisi J G (2013) Water Quality Management of Dams. Oficina de Textos, São Paulo. (in portuguese).
- Strayer, D L & Findlay, S E G (2010). Ecology of freshwater shore zones. Aquatic Sciences, 72, pp. 127–163. doi.org/10.1007/s00027-010-0128-9.
- Sward, D., et al. (2019) A systematic review of remotely operated vehicle surveys for visually assessing fish assemblages. Frontiers in Marine Science, 6, p. 134. doi.org/10.3389/fmars.2019.00134.
- Tušer, M., et al. (2014) Evaluation of potential bias in observing fish with a DIDSON acoustic camera. Fisheries Research, 155, pp. 114–121. doi.org/10.1016/j.fishres.2014.02.031.
- Wetzel, R G (2001). Limnology: Lake and River Ecosystems, Academic Press, San Diego.
- Winton, R. S., et al. (2019) Reviews and syntheses: Dams, water quality and tropical reservoir stratification. Biogeosciences, 16, pp. 1657–1671. doi.org/10.5194/bg-16-1657-2019.