While the construction industry acknowledges the importance of energy efficiency, the environmental impacts of building products are less understood. Life Cycle Assessment (LCA) is one of the most powerful analytical tools for evaluating a product’s, processes, or service’s environmental impacts over its entire life cycle.
An LCA study takes a long time to complete and necessitates detailed analysis and systematic investigation to model the product system. Various methods were used to estimate the environmental impact of its products and product systems; game theory (GT) agent-based model (ABM). In several cases, ABM and LCA have been combined.
Artificial intelligence (AI) is a field that encompasses all that makes a machine intelligent. A subset of AI, Machine learning (ML), relates to mathematical and statistical algorithms that learn from existing datasets to improve future performance.
A recently developed method for predicting a product’s or service’s environmental impacts by learning from Environmental Product Declarations (EPDs) of construction products has been published in the MDPI journal sustainability.
Based on previous LCA studies and results, the suggested method is the first attempt to evaluate the values of four impact categories: abiotic depletion potential for fossil resources, global warming potential, photochemical ozone creation potential, and acidification potential.
These four impact categories were chosen from a pool of seven total indicators in the database because of their varying levels of robustness, as defined by the European Commission’s EF 3.0.
Methodology
An EPD can be created for any product; they are now widely available for construction products that adhere to the EN 15804: A1 standard. EPDs are frequently published on websites that are governed by policies established by stakeholders such as industry associations, governments, or non-governmental organizations (NGOs). EPD data based on EN 15804: A1 is available online in the ÖKOBAUDAT platform, a standardized database.
The current research uses EPD data from construction products in the ÖKOBAUDAT database. EPD datasets are available in XML and Hypertext Markup Language on the ÖKOBAUDAT platform (HTML).
The EPDs were downloaded using a Selenium 3.1-based automated web-scraping tool written in Python. The ML algorithm that forecasts the impact assessment results for a given category used this descriptive and categorical data as inputs.
The information was gathered from 1188 EPDs on the KOBAUDAT platform. Both product and service LCA data were included in EPDs. There are 980 EPDs in the processed dataset, each with seven critical pieces of information.
The information is characterized using algorithms from the field of AI known as Natural Language Processing (NLP), a subfield of AI that deals with converting large amounts of text data into features that can be used in various machine learning algorithms. The encoded matrix of three sentences, as well as the number of words in each sentence, are shown in Table 1.
Table 1. Encoded matrix of the bag of words. Source: Koyamparambath et al., 2022
| |
Product |
Seal |
Component |
Treat |
Cool |
Steel |
Metal |
Work |
Hot |
| Name 1 |
1 |
1 |
2 |
1 |
0 |
0 |
0 |
1 |
0 |
| Name 2 |
1 |
0 |
0 |
1 |
1 |
1 |
1 |
0 |
0 |
| Name 3 |
0 |
0 |
1 |
0 |
0 |
1 |
1 |
0 |
1 |
The qualitative data from the EPD is processed using NLP to create a corpus of words, which is then observed for the number of times each word appears in the EPD. Figure 1 illustrates the procedure.
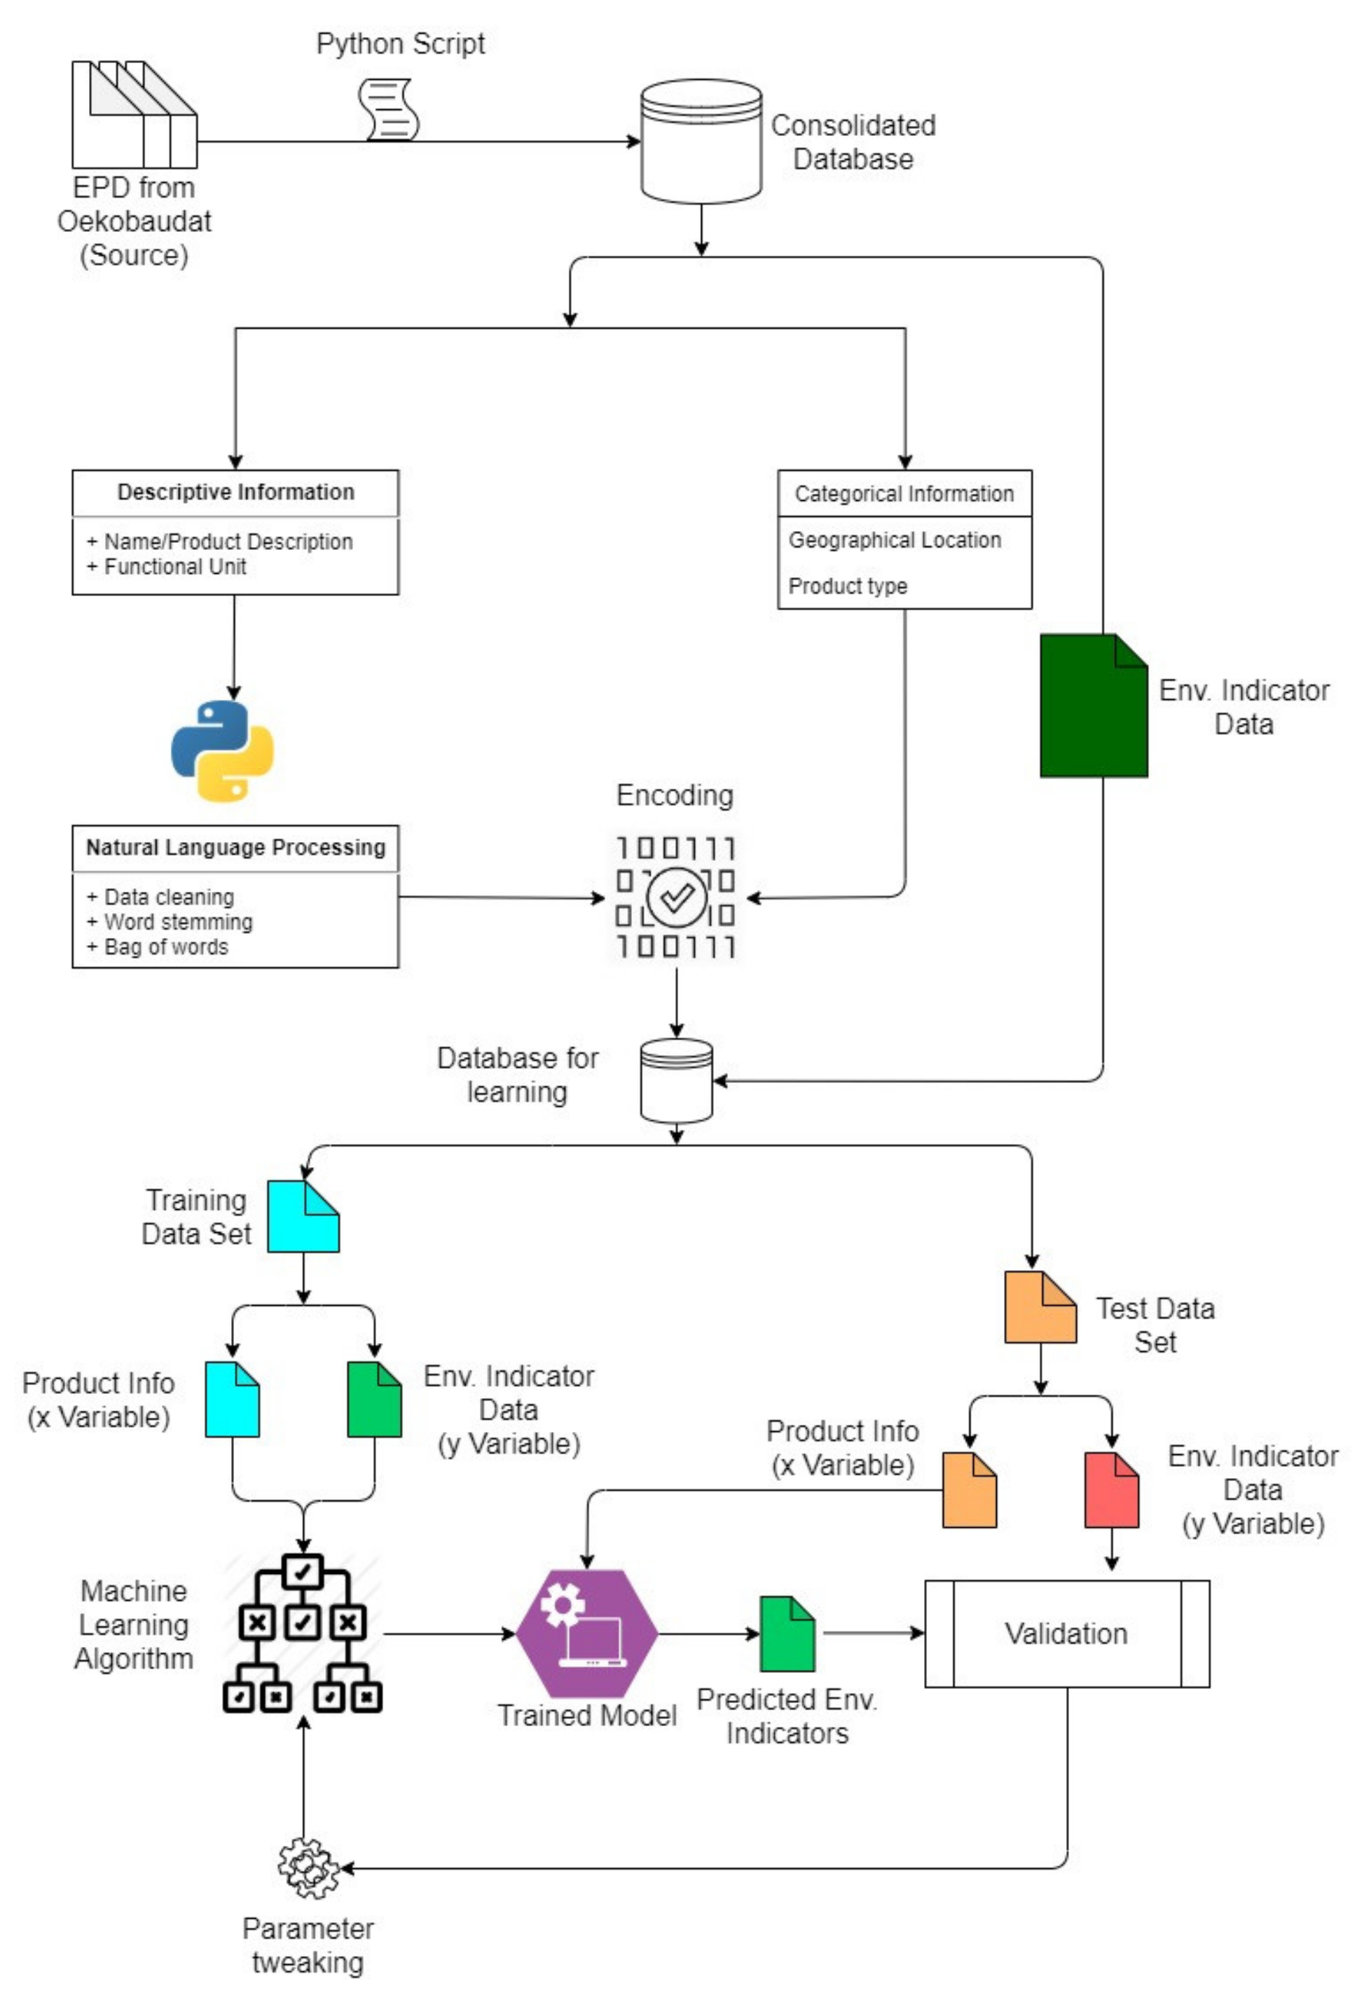
Figure 1. A flow diagram representation of the ensemble method. Image Credit: Koyamparambath et al., 2022
In a single instance, only one impact category can be predicted. As a result, the impact category values are segregated from the dataset, and data for one impact category is collected for all data points. The amount of training data available impacts the model’s performance. The random forest algorithm is used to model the machine learning process flow in Figure 1.
A tree-based algorithm divides the dataset into segments based on criteria until the best result is found. Random Forest (RF) is a classification and regression ensemble learning method that creates many decision trees. RF creates multisets of original data from datasets to generate additional data for training.
The dataset contains over 1500 features, which may cause the model to overfit. As a result, the method’s hyperparameters are modified. To improve the model’s prediction performance, Python has several modules for manipulating hyperparameters.
For tuning the model’s hyperparameters, grid search and random search algorithms are commonly used. A set of hyperparameter values is declared in a grid search. The predicted values are compared to the values of the selected indicator in the testing dataset.
Results and Discussion
Any product group for which EPDs have already been prepared based on agreed-upon PCRs can use the method developed. The database of EPDs produced after data processing is split into two datasets as a first step in the analysis.
After that, only the input variables are used to estimate the values of the impact categories chosen. The data input to the algorithm and the prediction put forth by the algorithm is depicted in Figure 2.
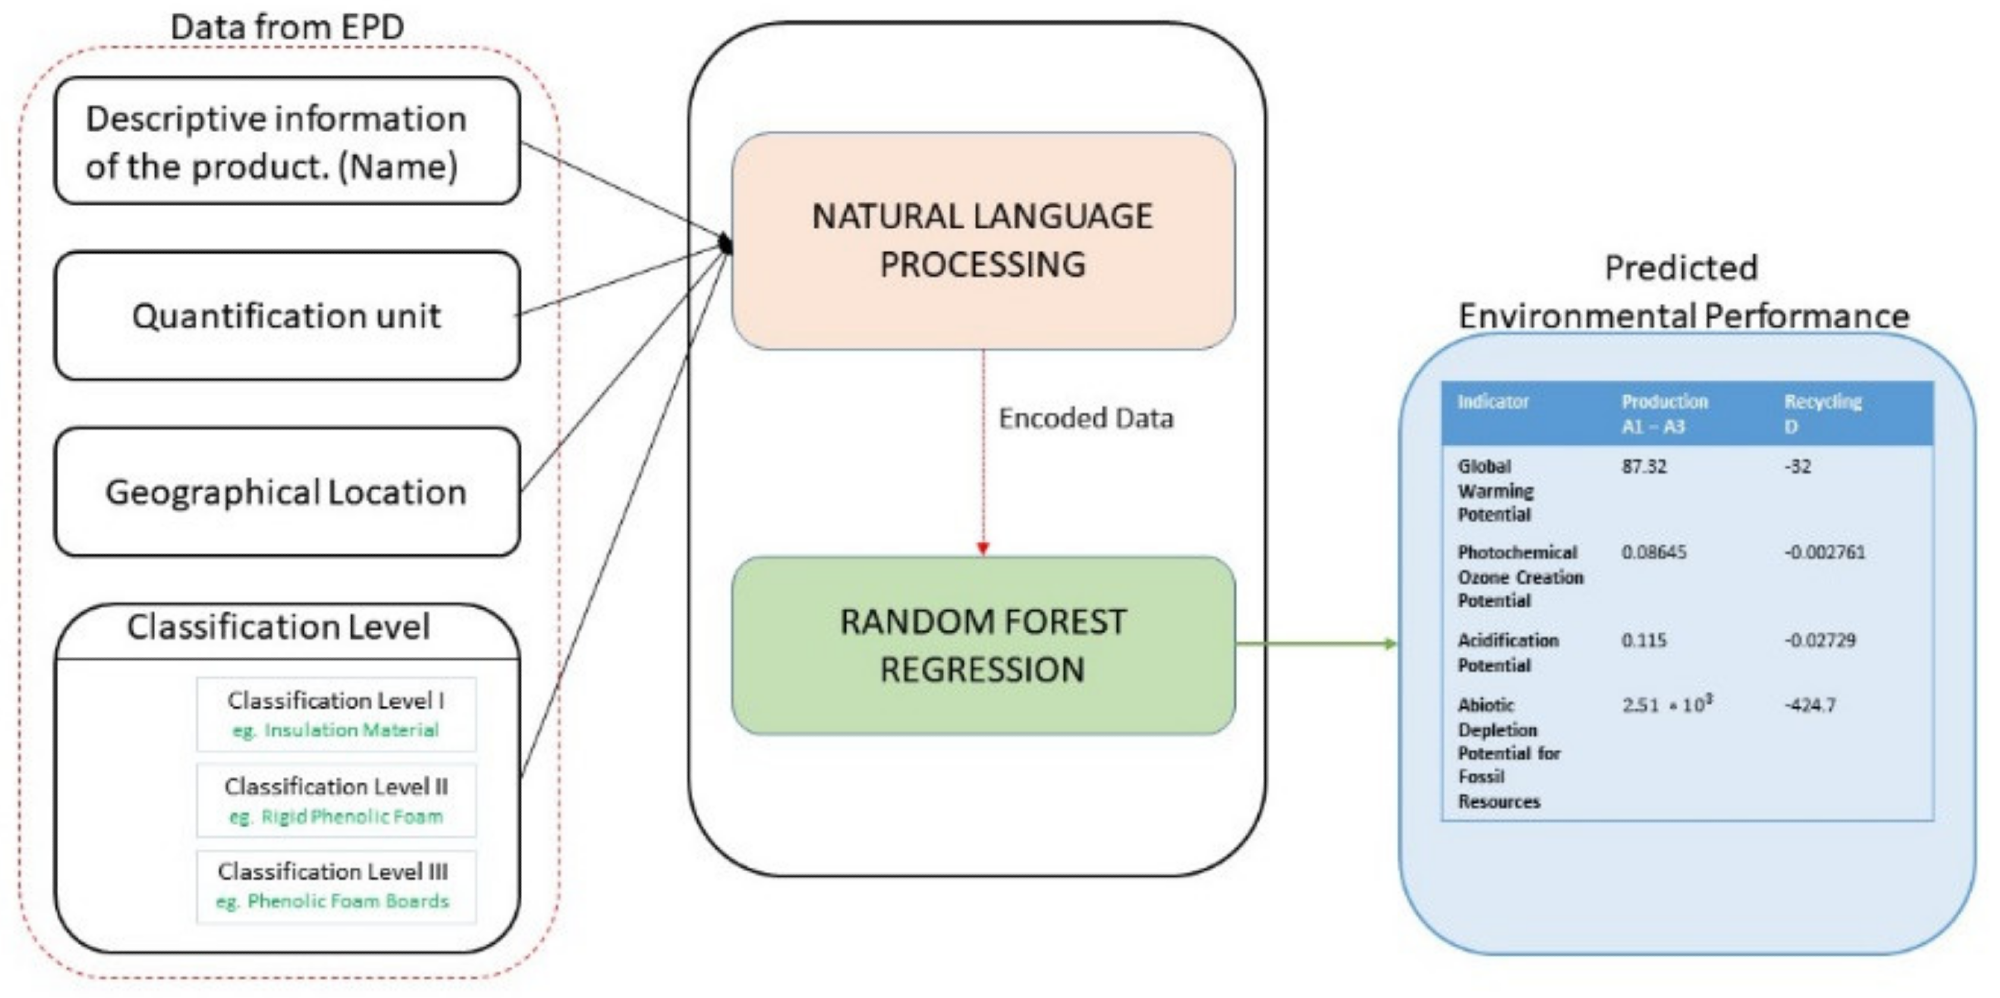
Figure 2. Inputs and outputs of the Machine Learning model. Image Credit: Koyamparambath et al., 2022
In random selection, 80% (784 EPDs) of the 980 EPDs were employed to train the model in iterations. The grid search algorithm optimized the model’s hyperparameters to find the best choice for each iteration.
R2 analysis and mean squared error are used to assess the model’s performance. The Kullback–Leibler divergence method is used to calculate the R2 value. Table 2 shows the model’s performance for various impact categories. In addition, the table shows the calculated error between the actual and predicted values.
Table 2. Mean squared error (MSE), R-squared analysis (R2), and the number of data points of the predicted impact categories. Source: Koyamparambath et al., 2022
| Impact Category |
Number of Data Points |
Mean Squared Error |
R-Squared Results |
| Photochemical Ozone Creation Potential |
196 |
0.07 |
70% |
| Abiotic depletion potential for fossil resources |
196 |
0.01 |
77% |
| Global warming potential |
196 |
0.28 |
81% |
| Acidification potential |
196 |
1.12 |
68% |
The average squared difference between the predicted and actual values is measured using a statistical method known as the mean squared error (MSE). Outliers have a big impact on regression models. As shown in Figure 3, outliers are the points away from the cluster cloud of points below each impact category.
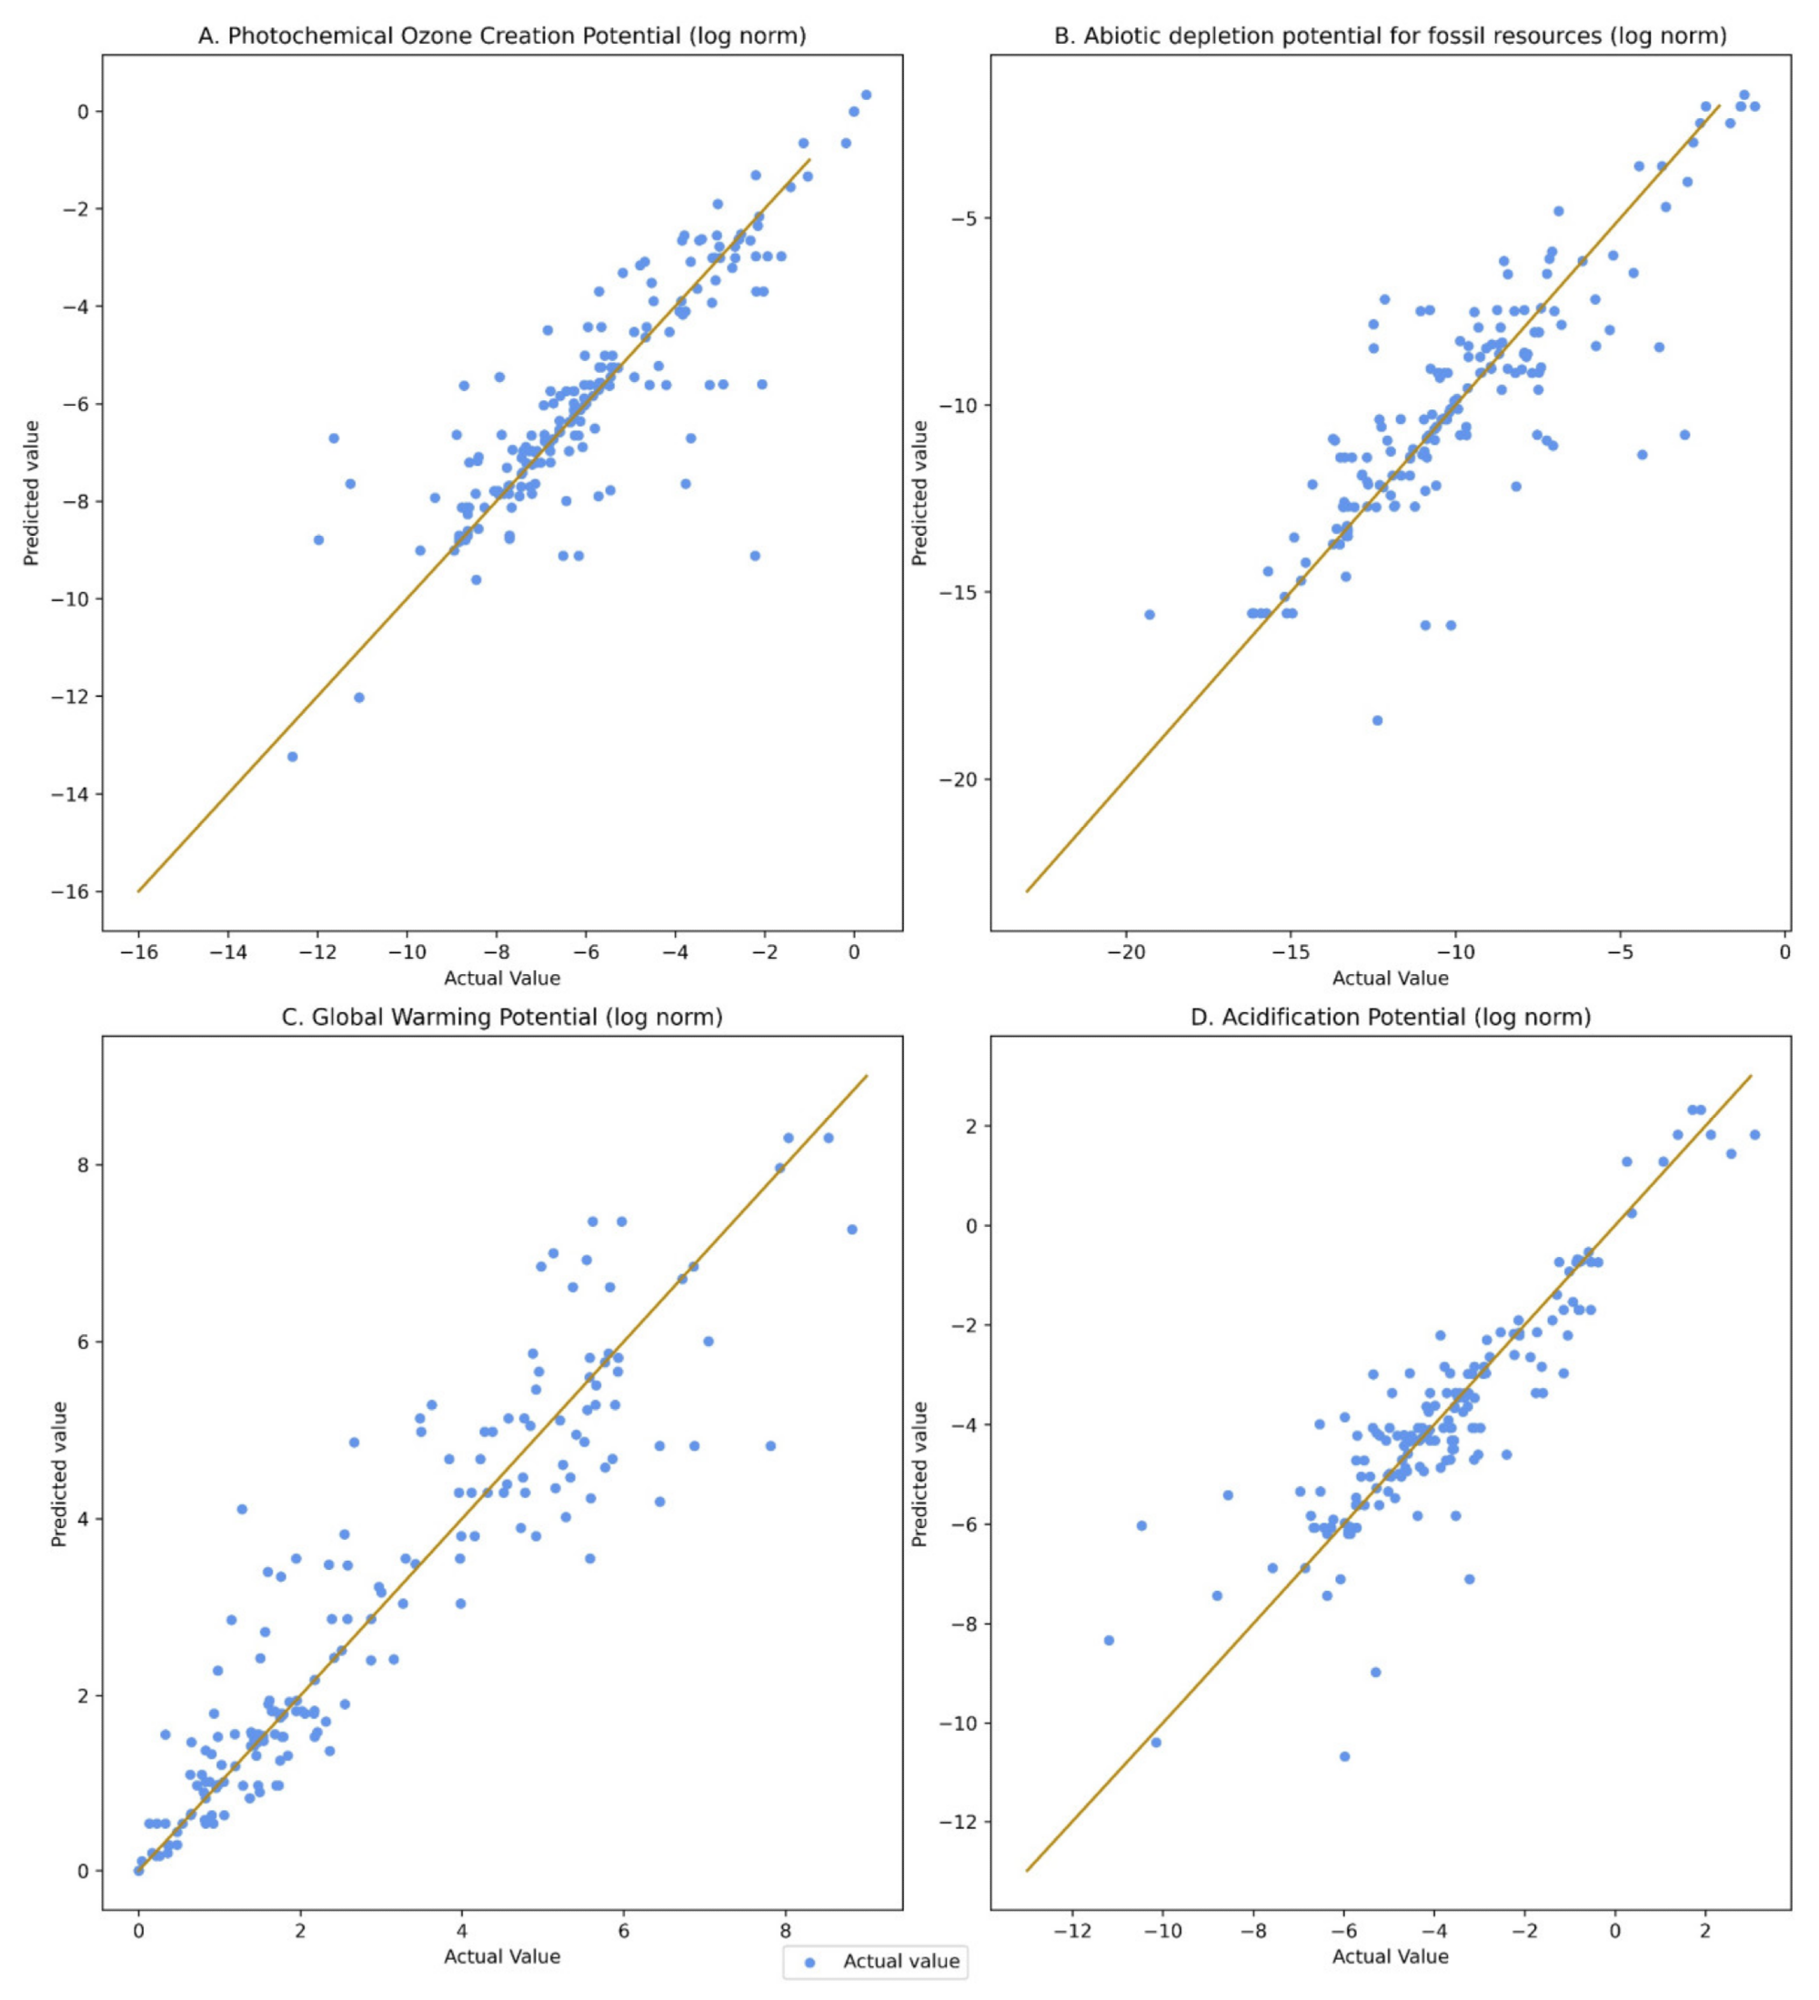
Figure 3. Visualization of prediction plot for the entire dataset for all the impact categories: (A) Photochemical Ozone Creation Potential, (B) Abiotic Depletion for Fossil Resources, (C) Global Warming Potential, (D) Acidification Potential. Image Credit: Koyamparambath et al., 2022
Figure 3 depicts the regression results and shows that, with the exception of a few outliers, the actual values are close to the prediction line. To demonstrate the application, an EPD is chosen from the testing dataset. Table 3 summarizes the outcome of the prediction.
Table 3. Predicted results and actual values of the seven environmental indicators from the EPD “reinforcement steel wire.” Source: Koyamparambath et al., 2022
| Environmental Impact Indicators |
Original
Values |
Units |
Predicted
Values |
| Photochemical Ozone Creation Potential (POCP) |
0.000266 |
kg Ethene eq. |
0.00019152 |
| Abiotic depletion potential for fossil resources (ADPF) |
7.627 |
MJ |
6.102 |
| Global warming potential (GWP) |
0.6834 |
kg CO2 eq. |
0.564 |
| Acidification potential (AP) |
0.001282 |
kg SO2 eq. |
0.00071792 |
According to the findings, the prediction accuracy of key indicators is much higher than the others. Furthermore, due to the bagging and encoding of the descriptive data, the number of features used is much higher than the database size. Overall, the results of the method displayed the capability to use regression analysis with qualitative data from a newly implemented product.
Conclusion
The growing demand for information about the environmental effects of products and services prompts the development of an AI-based model that can predict them with minimal time, data, and modeling. This article presents a working AI-based prediction model based on an existing database of EPDs, which is a way of harmonizing LCA results.
The results show that the model can indicate environmental impact categories using regression analysis and qualitative product information. The researchers plan to apply this method to other product groups as well as non-aggregated datasets of LCA results.
The more EPDs there are, the more precise the results will be. Combining multiple EPD databases for construction products from various countries as an enlarged data source, first at the European level and then at the international level, could be an exciting step forward.
Journal Reference
Koyamparambath, A., Adibi, N., Szablewski, C., Adibi, S. A., Sonnemann, G. (2022) Implementing Artificial Intelligence Techniques to Predict Environmental Impacts: Case of Construction Products. Sustainability, 14(6), p. 3699. Available Online: https://www.mdpi.com/2071-1050/14/6/3699/htm.
References and Further Reading
- Clift, R., et al. (2000) The application of Life Cycle Assessment to Integrated Solid Waste Management. Part 1—Methodology. Process Safety and Environmental Protection, 78(4), pp. 279–287. doi.org/10.1205/095758200530790.
- ISO 14025; Environmental Labels and Declarations—Type III Environmental Declarations—Principles and Procedures. In: International Organization for Standardization: Geneva, Switzerland, 2010. Available at: http://www.cscses.com/uploads/2016328/20160328110527052705.pdf (Accessed 7 March 2022).
- Jose, F., et al. (2010) Developing LCA Techniques for Emerging Systems: Game Theory, Agent Modeling as Prediction Tools. In: Proceedings of the 2010 IEEE International Symposium on Sustainable Systems and Technology, Arlington, VA, USA, 17–19 May; pp. 1–6. doi.org/10.1109/ISSST.2010.5507728.
- Halog, A & Manik, Y (2011) Advancing integrated systems modelling framework for life cycle sustainability assessment. Sustainability, 3(2), pp. 469–499. doi.org/10.3390/su3020469.
- Bonabeau, E (2002) Agent-based modeling: Methods and techniques for simulating human systems Processing of the National Academy of Sciences of the USA, 99(S3), pp. 7280–7287. doi.org/10.1073/pnas.082080899.
- Miller, S. A., et al. (2012) Stochastic Approach to Model Dynamic Systems in Life Cycle Assessment. Journal of Industrial Ecology, 17(3), pp. 352–362. doi.org/10.1111/j.1530-9290.2012.00531.x.
- .Micolier, A., et al. (2019) To what extent can agent-based modelling enhance a life cycle assessment? Answers based on a literature review. Journal of Cleaner Production, 239, p. 118123. doi.org/10.1016/j.jclepro.2019.118123.
- Das, K & Behera, R N (2017) A Survey on Machine Learning: Concept, Algorithms and Applications. International Journal of Innovative Research in Computer and Communication Engineering, 5(2), pp. 1301–1309.
- Barros, N N & Ruschel, R C (2020) Machine Learning for Whole-Building Life Cycle Assessment: A Systematic Literature Review. In: Proceedings of the 18th International Conference on Computing in Civil and Building Engineering, São Paulo, Brazil, 18–20 August ; Springer: Cham, Switzerland. pp. 109–122. doi.org/10.1007/978-3-030-51295-8_10.
- Nabavi-Pelesaraei, A., et al. (2018) Integration of artificial intelligence methods and life cycle assessment to predict energy output and environmental impacts of paddy production. Science of The Total Environment, 631–632, pp. 1279–1294. doi.org/10.1016/j.scitotenv.2018.03.088.
- Kaab, A., et al. (2019) Combined life cycle assessment and artificial intelligence for prediction of output energy and environmental impacts of sugarcane production. Science of The Total Environment, 664, pp. 1005–1019. doi.org/10.1016/j.scitotenv.2019.02.004.
- Ahmad, M. W., et al. (2017) Trees vs. Neurons: Comparison between random forest and ANN for high-resolution prediction of building energy consumption. Energy and Building, 147, pp. 77–89. doi.org/10.1016/j.enbuild.2017.04.038.
- Stangierski, J., et al. (2019) Multiple regression models and Artificial Neural Network (ANN) as prediction tools of changes in overall quality during the storage of spreadable processed Gouda cheese. European Food Research and Technology, 245, pp. 2539–2547. doi.org/10.1007/s00217-019-03369-y.
- Hou, P., et al. (2020) Estimate ecotoxicity characterization factors for chemicals in life cycle assessment using machine learning models. Environment International, 135, p. 105393. doi.org/10.1016/j.envint.2019.105393.
- European Commission. Environmental Footprint. In: European Platform on Life Cycle Assessment. Available at: https://eplca.jrc.ec.europa.eu/EnvironmentalFootprint.html
- Passer, A., et al. (2015) Environmental product declarations entering the building sector: Critical reflections based on 5 to 10 years experience in different European countries. The International Journal of Life Cycle Assessment, 20, pp. 1199–1212. doi.org/10.1007/s11367-015-0926-3.
- Allander, A (2001) Successful certification of an environmental product declaration for an ABB product. Corporate Environmental Strategy, 8(2), pp. 133–141. doi.org/10.1016/S1066-7938(01)00094-X.
- Bovea, M.D., et al. (2013) Environmental product declaration (EPD) labelling of construction and building materials. In: Eco-Efficient Construction and Building Materials. Life Cycle Assessment (LCA), Eco-Labelling and Case Studies; Woodhead Publishing: Cambridge, UK, pp. 125–150. doi.org/10.1533/9780857097729.1.125.
- Del Borghi, A (2013) LCA and communication: Environmental Product Declaration. The International Journal of Life Cycle Assessment, 18, pp. 293–295. doi.org/10.1007/s11367-012-0513-9.
- Minkov, N., et al. (2015) Type III Environmental Declaration Programmes and harmonization of product category rules: Status quo and practical challenges. Journal of Cleaner Production, 94, pp. 235–246. doi.org/10.1016/j.jclepro.2015.02.012.
- Durão, V., et al. (2020) Assessment and communication of the environmental performance of construction products in Europe: Comparison between PEF and EN 15804 compliant EPD schemes. Resources, Conservation and Recycling, 156, p. 104703. doi.org/10.1016/j.resconrec.2020.104703.
- Adibi, N., et al. (2019) Mainstream Use of EPDs in Buildings: Lessons Learned from Europe. In: ISBS 2019; IntechOpen: London, UK, p. 890.
- Institut Bauen und Umwelt e.V. Available at: https://ibu-epd.com/ibu/
- Lasvaux, S., et al. (2015) Comparison of generic and product-specific Life Cycle Assessment databases: Application to construction materials used in building LCA studies. The International Journal of Life Cycle Assessment, 20, pp. 1473–1490. doi.org/10.1007/s11367-015-0938-z.
- Pardede, E., et al. (2008) XML data update management in XML-enabled database. Journal of Computer and System Sciences, 74(2), pp. 170–195. doi.org/10.1016/j.jcss.2007.04.008.
- Recchioni, M., et al. (2013) ILCD Data Network and ELCD Database—Current Use and Further Needs for Supporting Environmental Footprint and Life Cycle Indicator Projects. In: Joint Research Centre- Institute for Environment and Sustainability, Report EUR 25744 EN; European Commission: Luxembourg.
- Baitz, M., et al. (2014) GaBi Database & Modelling Principles. In: PE International AG: Stuttgart, Germany.
- Oekobaudat. Available at: https://www.oekobaudat.de/datenbank/browser-oekobaudat.html (Accessed 7 March 2022).
- Selenium Selenium Client Driver Documentation. Available at: https://www.selenium.dev/selenium/docs/api/py/ .
- Sqlite3 sqlite3—DB-API 2.0 interface for SQLite databases. Available at: https://docs.python.org/3/library/sqlite3.html .
- Probst, P., et al. (2019) Hyperparameters and tuning strategies for random forest. Wiley Interdisciplinary Reviews - Data Mining and Knowledge Discovery, 9(3), p. e1301. doi.org/10.1002/widm.1301.
- Zeroual, I & Lakhouaja, A (2018) Data science in light of natural language processing: An overview. Procedia Computer Science, 127, pp. 82–91. doi.org/10.1016/j.procs.2018.01.101.
- Joseph, S. R., et al. (2016) Natural Language Processing: A Review. International Journal of Research in Engineering and Applied Science, 6(3). Available at: https://www.researchgate.net/profile/Sethunya-Joseph/publication/309210149_Natural_Language_Processing_A_Review/links/5805ea1f08ae03256b75d965/Natural-Language-Processing-A-Review.pdf
- Vallbé, J. J., et al. (2007) Stemming and lemmatisation: Improving knowledge management through language processing techniques. In: Trends in Legal Knowledge: The Semantic Web and the Regulation of Electronic Social Systems; European Press Academic Publishing: Florence, Italy, pp. 1–16. Available at: https://www.researchgate.net/publication/228704765.
- Kotsiantis, S B (2013) Decision trees: A recent overview. Artificial Intelligence Review, 39, pp. 261–283. doi.org/10.1007/s10462-011-9272-4
- Soleimanian-Gharehchopogh, F., et al. (2012) Application of Decision Tree Algorithm for Data Mining in Healthcare Operations: In: International Journal of Computer Applications, A Case Study, 52, pp. 0975–8887. Available at: https://research.ijcaonline.org/volume52/number6/pxc3881613.pdf
- Fawagreh, K., et al. (2014) Random forests: From early developments to recent advancements. Systems Science & Control Engineering, 2(1), pp. 602–609. doi.org/10.1080/21642583.2014.956265.
- Ho, T K (1995) Random decision forests. In: Proceedings of the 3rd International Conference on Document Analysis and Recognition, Montreal, QC, Canada, 14–16 August, pp. 278–282. doi.org/10.1109/ICDAR.1995.598994.
- Umarani, V & Rathika, C (2019) Predicting Safety Information of Drugs Using Data Mining Technique. International Journal of Computer Engineering & Technology, 10, pp. 83–90. Available at: http://iaeme.com/Home/issue/IJCET?Volume=10&Issue=2
- Arlot, S & Celisse, A (2010) A survey of cross-validation procedures for model selection. Statistics Surveys, 4, pp. 40–79. doi.org/10.1214/09-SS054
- Cameron, A C & Windmeijer, F A G (1997) An R-squared measure of goodness of fit for some common nonlinear regression models. Journal of Econometrics, 77(2), pp. 329–342. doi.org/10.1016/S0304-4076(96)01818-0.