Plant diseases and pests lead to a loss in the agricultural sector. Hence early identification and prevention of different plant diseases are vital in agriculture technology. The conventional manual visual observation for disease diagnosis methods is inefficient and time-consuming and substantially increases expenses.
Also, the conventional ML approaches were not suitable for real-life detection scenarios with non-uniform complex backgrounds. Recently, the You Only Look Once (YOLO) algorithm unifies target classification and localization into a regression problem. It directly carries out regression to identify targets in the image, leading to improvements in the detection speed.
The recent research concentrates on plant disease detection in apples. Apple plants are susceptible to different diseases. The two most severe and common fungus diseases are scab (Venturia inaequalis) and rust (Gymnosporangium juniperi-virginianae), impacting yield and quality.
The research proposes a multi-scale disease detection model based on an enhanced version of the advanced YOLOv4 algorithm. It is applied to real-time apple plant disease identification in the natural environment.
The proposed model has CSPDarkNet53 modified to be Dense-CSPDarkNet53 by introducing DenseNet blocks to improve feature transfer and reuse for small-target detection and the number of network layers has been reduced by modifying the convolution blocks. Furthermore, a modified path aggregation network (PANet) has been utilized to preserve fine-grain localization information and enhance feature fusion of multi-scale semantic information.
The proposed model can automatically identify the discriminating features of each disease of various sizes and also the coexistence of multiple conditions within the same image with high accuracy under a complex orchard environment.
Methodology
The Proposed Network Structure of the Detection Model
Researchers used an enhanced YOLOV4 algorithm, a high-precision one-stage object detection model for disease detection. During object detection, the input image is divided into N×N uniformly equal grids. Figure 1 depicts the detection mechanism.
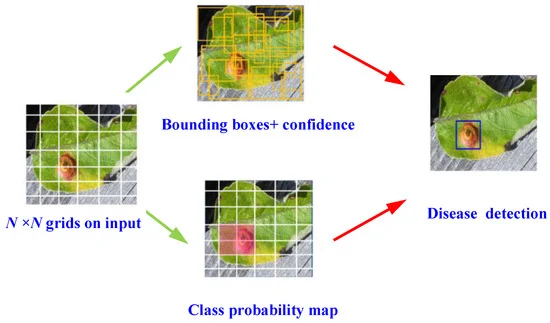
Figure 1. Schematic of YOLOv4 object detection algorithm for disease detection. Image Credit: Roy and Bhaduri, 2021.
The complete schematic of the model network architecture has three parts: a backbone for the feature extraction, neck for semantic representation of extracted features, and head for the prediction as shown in Figure 2.
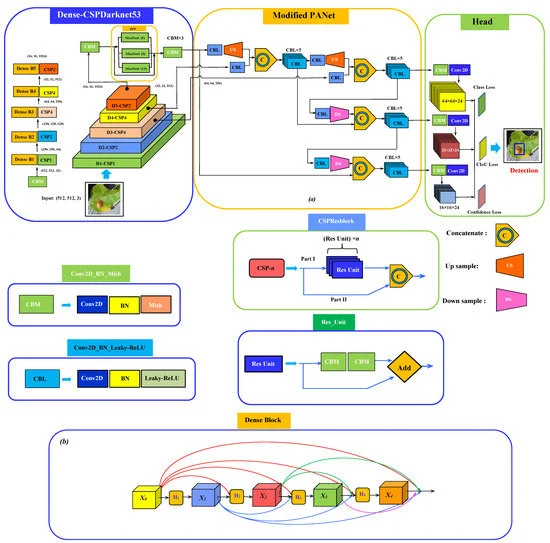
Figure 2. Schematic of (a) the proposed network architecture for plant disease detection consisting of Dense-CSPDarknet53 integrating SPP as the backbone, modified PANet as a neck with a regular YOLOv3 head; (b) dense block structure. Image Credit: Roy and Bhaduri, 2021.
The data augmentation procedure (i.e., rotation, mirror projection, color balancing, brightness transformation, blur processing) was used (as depicted in Figure 3) to increase the variability of input images obtained from various environments, which increases the robustness of the detection model.
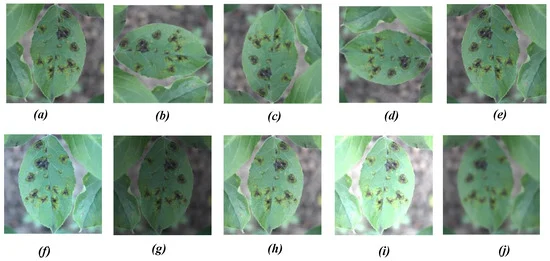
Figure 3. Different image augmentation methods: (a) original image, (b) 90° ACW rotation, (c) 180° ACW rotation, (d) 270° ACW rotation, (e) horizontal mirror projection, (f) color balancing, (g–i) brightness transformation, and (j) blur processing. Image Credit: Roy and Bhaduri, 2021.
Performance Matrices of the Detection Model
In deep learning-based object detection models, some important statistical measures of matrices, including intersection over union (IoU), precision (P) recall (R), F-1 score, average precision (AP), and mean average precision (mAP), are generally used to evaluate the performance of the model.
Figure 4 depicts the Schematic definition of precision (P), recall (R), and intersection over union (IoU) during object detection, and Figure 5 shows the schematic of offset regression for target bounding box prediction process during CIoU loss in bounding box regression for proposed object detection algorithm.
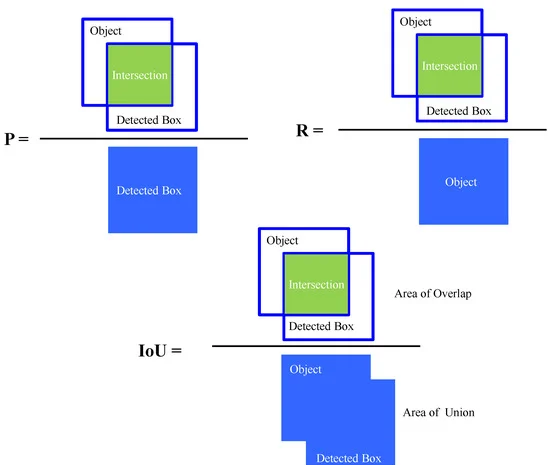
Figure 4. Schematic definition of precision (P), recall (R), and intersection over union (IoU) during object detection. Image Credit: Roy and Bhaduri, 2021.
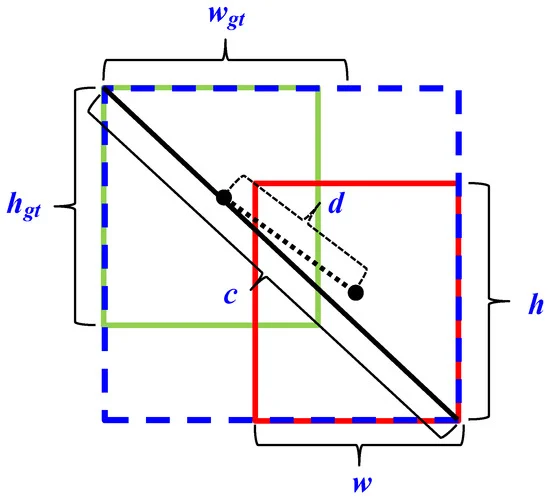
Figure 5. Schematic of offset regression for target bounding box prediction process during CIoU loss in bounding box regression for proposed object detection algorithm. Image Credit: Roy and Bhaduri, 2021.
Results
Around 600 original images consisting of 200 images from each of the two apple diseases (i.e., scab and rust) and 200 images containing both scab and rust were collected from the Kaggle PlantPathology Apple Dataset to construct the single dataset. Different image augmentation procedures enabled the expansion of the single dataset tenfold to obtain the custom dataset for the research (Table 1).
Table 1. Different diseases in apple plant and corresponding class identifier with the original number of images and images produced by augmentation method for the custom dataset. Source: Roy and Bhaduri, 2021.
| Object Class |
Scab |
Rust |
Mix (Scab and Rust) |
| Class identifier |
1 |
2 |
1, 2 |
| Original images |
200 |
200 |
200 |
| Rotation |
800 |
800 |
800 |
| Color balancing |
200 |
200 |
200 |
| Brightness transform |
600 |
600 |
600 |
| Blur processing |
200 |
200 |
200 |
| Total number of images/class |
2000 |
2000 |
2000 |
For image annotation of target classes in the custom dataset, a Python-based open-source script LabelImg was employed.
Table 2 details the local computing resources and deep neural network (DNN) environment specifications. The initial configuration parameters like-number of channels, initial learning rate, momentum value, decay regularization, were kept similar to the original parameters in the YOLOV4 model.
Table 2. Local computing resources and DNN environments. Source: Roy and Bhaduri, 2021.
| Testing Environment |
Configuration Parameter |
| OS |
Windows 10 Pro 64 |
| CPU |
Intel Core i5-10210U |
| RAM |
8 GB DDR4 |
| GPU |
NVIDIA GeForce RTX 2080 |
| GPU acceleration env. |
CUDA 10.2.89 |
| GPU acclerated DNN lib. |
cuDNN 10.2 v7.6.5 |
| Int. development env. |
Visual Studio comm. v15.9 (2017) |
| Comp. Vision lib. |
OpenCV 4.5.1-vc14 |
Table 3 depicts the primary initial configuration parameters corresponding to the enhanced YOLOV4 model.
Table 3. Initial configuration parameters of improved YOLOv4 model. Source: Roy and Bhaduri, 2021.
| Input Size of Image |
Batch |
Subdivision |
Channels |
Momentum |
| 512×512 |
16 |
4 |
3 |
0.9 |
| Initial Learning Rate |
Decay |
Classes |
Filters |
Training Steps |
| 0.001 |
0.005 |
4 |
27 |
85,000 |
Table 4 shows the values of IoU, F1-score, mAP, final validation loss, and average detection time compared with YOLOv3 and YOLOv4. It is seen that the proposed model attained the highest IoU value of 0.922, which is 6.1% over the original YOLOv4 model.
Table 4. Comparison of IoU, F1 Score, final loss, detection speed, and average detection time between YOLOv3, YOLOv4, and the proposed model. Source: Roy and Bhaduri, 2021.
Detection
Model |
IoU |
F1-Score |
mAP |
Validation
Loss |
Detection
Time
(ms) |
Detection
Speed
(FPS) |
| YOLOv3 |
0.787 |
0.822 |
0.781 |
11.12 |
16.254 |
61.52 |
| YOLOv4 |
0.861 |
0.883 |
0.839 |
4.31 |
15.301 |
65.22 |
Proposed
model |
0.922 |
0.959 |
0.912 |
1.65 |
17.577 |
56.89 |
Thus, the proposed detection model has better accuracy in detecting bounding boxes compared to the other two models. The model demonstrated better efficiency and accuracy in detection performance with an F1 score of 0.959 and mAP of 0.912, which are 7.6% and 7.3% improvements from YOLOv4.
The detection time of the proposed model was greater than the YOLOv4 model with a detection time of 17.577 ms (or 56.89 FPS). The comparison of precision-recall (PR) curves shown in Figure 6 illustrates that the precision value from the proposed model is greater for a particular recall. This shows that the current model demonstrates better detection accuracy compared to YOLOv3 and YOLOv4.
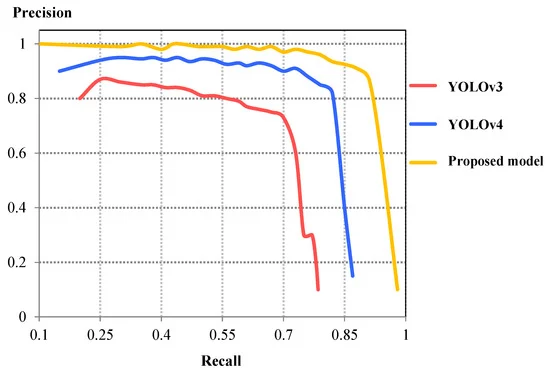
Figure 6. Comparison of P-R curves between YOLOv3, YOLOv4, and proposed detection model. Image Credit: Roy and Bhaduri, 2021.
Figure 7 compares the validation loss curves between three models. The proposed model showed better convergence characteristics compared to YOLOv4. Table 4 shows the comparison of IoU, F1 Score, final loss, detection speed, and average detection time between YOLOv3, YOLOv4, and the proposed model.
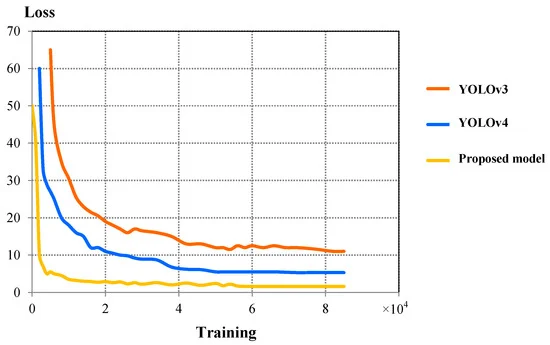
Figure 7. Comparison of validation loss curves between YOLOv3, YOLOv4, and proposed detection model. Image Credit: Roy and Bhaduri, 2021.
Table 5 shows the detailed detection results containing TP, FP, and FN for each class, and corresponding precision, recall, and F-1 score are presented in the proposed model, which has demonstrated relatively higher precision and recall in rust, namely, 94.37% and 98.41%, respectively.
Table 5. Comparison of detection results between YOLOv3, YOLOv4, and the proposed model on the test dataset. Source: Roy and Bhaduri, 2021.
| Model |
Class |
Objects |
TP |
FP |
FN |
P (%) |
R (%) |
F1-Score |
| YOLOv3 |
All |
3517 |
2688 |
750 |
408 |
78.18 |
86.82 |
82.27 |
| Scab |
1975 |
1501 |
398 |
187 |
79.04 |
88.92 |
83.69 |
| Rust |
1542 |
1187 |
352 |
221 |
77.12 |
84.30 |
80.56 |
| YOLOv4 |
All |
3517 |
2944 |
525 |
248 |
84.86 |
92.23 |
88.39 |
| Scab |
1975 |
1643 |
286 |
137 |
85.17 |
92.30 |
88.59 |
| Rust |
1542 |
1301 |
239 |
111 |
84.48 |
92.13 |
88.14 |
Proposed
Model |
All |
3517 |
3272 |
212 |
62 |
93.91 |
98.14 |
95.98 |
| Scab |
1975 |
1845 |
127 |
39 |
93.55 |
97.93 |
95.69 |
| Rust |
1542 |
1427 |
85 |
23 |
94.37 |
98.41 |
96.35 |
Detection Results for Different Plant Disease Class
Figures 8 and 9 show the results from the proposed model for two distinct diseases in the apple plant considering two different infected leaves belonging to each of the disease classes compared with YOLOv3 and YOLOv4 models.
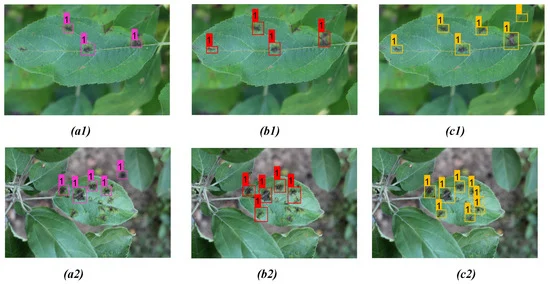
Figure 8. Comparison of detection result for apple scab on two distinct apple leaves from three models: (a1,a2) YOLOv3; (b1,b2) YOLOv4; (c1,c2) proposed model. Image Credit: Roy and Bhaduri, 2021.
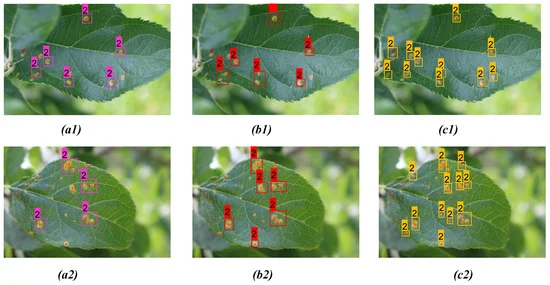
Figure 9. Comparison of detection result for apple rust on two distinct apple leaves from three models: (a1, a2) YOLOv3; (b1, b2) YOLOv4; (c1, c2) proposed model. Image Credit: Roy and Bhaduri, 2021.
Tables 6, 7, and 8 give a detailed comparison between the three models. From the detection result, one can see that the bounding box prediction from the proposed model is more accurate compared to YOLOv3 and YOLOv4 detection models for all disease classes.
Table 6. Comparison of detection results between YOLOv3, YOLOv4, and the proposed model for apple scab detection as shown in Figure 8. Bold highlights the best result obtained from corresponding model prediction. Source: Roy and Bhaduri, 2021.
| Figs. No |
Model |
Detc. |
Undetc. |
Misdetc. |
Confidence Scores |
| Figure 8(a1) |
YOLOv3 |
3 |
3 |
0 |
0.84, 0.93, 0.98 |
| Figure 8(b1) |
YOLOv4 |
4 |
2 |
0 |
0.94, 1.00, 1.00, 0.98 |
| Figure 8(c1) |
Proposed
model |
6 |
0 |
0 |
0.98, 1.00, 1.00,
0.97, 1.00, 1.00 |
| Figure 8(a2) |
YOLOv3 |
3 |
5 |
1 |
0.81, 0.94, 0.77 |
| Figure 8(b2) |
YOLOv4 |
4 |
4 |
1 |
0.97, 0.81, 1.00, 0.78 |
| Figure 8(c2) |
Proposed
model |
8 |
1 |
0 |
1.00, 1.00, 0.92, 1.00
1.00, 1.00, 1.00, 0.97 |
Table 7. Comparison of detection results between YOLOv3, YOLOv4, and proposed model for apple rust detection as shown in Figure 9. Bold highlights the best result obtained from corresponding model prediction. Source: Roy and Bhaduri, 2021.
| Figs. No |
Model |
Detc. |
Undetc. |
Misdetc. |
Confidence Scores |
| Figure 9(a1) |
YOLOv3 |
6 |
5 |
0 |
0.84, 0.93, 0.79, 0.93, 0.89, 0.94 |
| Figure 9(b1) |
YOLOv4 |
8 |
3 |
0 |
0.88, 0.91, 0.87, 0.91, 0.78, 0.83
0.99, 0.89 |
| Figure 9(c1) |
Proposed
model |
11 |
0 |
0 |
0.96, 0.91, 1.00, 1.00, 0.92, 1.00
1.00, 1.00, 0.98, 1.00, 0.97 |
| Figure 9(a2) |
YOLOv3 |
7 |
7 |
1 |
0.91, 0.78, 0.98, 0.76,
0.79, 0.92, 0.86 |
| Figure 9(b2) |
YOLOv4 |
8 |
6 |
1 |
0.92, 0.91, 0.83, 1.00, 0.92, 0.87,
0.91, 0.83 |
| Figure 9(c2) |
Proposed
model |
12 |
2 |
0 |
0.95, 0.99, 0.87, 1.00, 0.92, 1.00
0.94, 1.00, 0.98, 1.00, 0.83, 0.97 |
Table 8. Comparison of detection results between YOLOv3, YOLOv4, and proposed model for both apple scab and rust as shown in Figure 10. Bold highlights the best result obtained from corresponding model prediction. Source: Roy and Bhaduri, 2021.
| Figs. No |
Model |
Detc. |
Undetc. |
Misdetc. |
Confidence Scores |
| Figure 10(a1) |
YOLOv3 |
6 |
5 |
0 |
0.84, 0.88, 0.76, 0.79, 1.00, 0.98 |
| Figure 10(b1) |
YOLOv4 |
7 |
4 |
0 |
0.82, 0.77, 1.00, 0.93, 1.00
0.83, 0.94 |
| Figure 10(c1) |
Proposed
model |
10 |
1 |
0 |
0.90, 0.87, 1.00, 0.92, 1.00
0.94, 1.00, 1.00, 0.83, 0.97 |
| Figure 10(a2) |
YOLOv3 |
6 |
6 |
1 |
0.91, 0.67, 0.81 0.94, 0.77, 0.79 |
| Figure 10(b2) |
YOLOv4 |
6 |
6 |
1 |
0.97, 0.86, 1.00, 0.77, 0.85, 0.67 |
| Figure 10(c2) |
Proposed
model |
9 |
3 |
0 |
0.72, 0.90, 1.00, 0.92, 1.00
0.83, 0.95, 0.94, 0.99 |
The proposed model performed far better when compared to the other models in the case of scab detection (Figure 8 and Table 6), rust detection (Figure 9(a1–c1), Table 7, Figure 9 (a2, b2)), and multi-class disease detection (Figure 10 and Table 8).
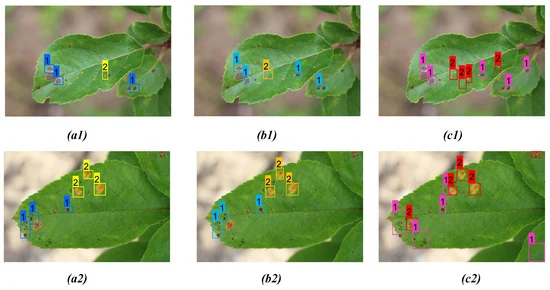
Figure 10. Comparison of detection result for both apple scab and rust on two distinct apple leaves from three models: (a1, a2) YOLOv3; (b1, b2) YOLOv4; (c1, c2) proposed model. Image Credit: Roy and Bhaduri, 2021.
The observations show that the proposed detection model has a better capability and higher adaptability of disease detection in various environments compared to YOLOv3 and YOLOv4.
Applications
The proposed model can be modified to optimize for accuracy and is an effective technique for detecting various plant diseases under complex scenarios. It can also be used in various generic disease detection, fruit and crop detection, and automated agricultural detection processes.
See a full list of available Agricultural Robotics.
Journal Reference:
Roy, A M and Bhaduri, J (2021) A Deep Learning Enabled Multi-Class Plant Disease Detection Model Based on Computer Vision. AI, 2(3), pp. 413–428. Available at: https://doi.org/10.3390/ai2030026.
References and Further Reading
- Tyagi, A C (2016) Towards a second green revolution. Irrigation and Drainage, 65, pp. 388–389. doi.org/10.1002/ird.2076.
- Vougioukas, S G (2019) Agricultural robotics. Annual Review of Control, Robotics, and Autonomous Systems, 2, pp. 365–392. doi.org/10.1146/annurev-control-053018-023617.
- Wang, Q., et al. (2013) Automated crop yield estimation for apple orchards. Experimental Robotics, 88, pp. 745–758. doi.org/10.1007/978-3-319-00065-7_50.
- Basnet, B & Bang, J (2018) The state-of-the-art of knowledge-intensive agriculture: A review on applied sensing systems and data analytics. Journal of Sensor and Actuator Networks, 3, p. 3528296. https://doi.org/10.1155/2018/3528296.
- Fu, L., et al. (2020) Application of consumer RGB-D cameras for fruit detection and localization in field: A critical review. Computers and Electronics in Agriculture, 177, p. 105687. doi.org/10.1016/j.compag.2020.105687.
- SepuLveda, D., et al. (2020) Robotic aubergine harvesting using dual-arm manipulation. IEEE Access, 8, pp. 121889–121904. doi.org/10.1109/ACCESS.2020.3006919.
- Peltoniemi, J. I., et al. (2015) Reflectance and polarization characteristics of various vegetation types. In: Light Scattering Reviews; Springer: Berlin/Heidelberg, Germany; 9, pp. 257–294.
- Zhao, Y., et al. (2016) A review of key techniques of vision-based control for harvesting robot. Computers and Electronics in Agriculture, 127, pp. 311–323. doi.org/10.1016/j.compag.2016.06.022.
- Shamshiri, R., et al. (2018) Research and development in agricultural robotics: A perspective of digital farming. International Journal of Agricultural and Biological Engineering, 11, pp. 1–14. doi.org/10.25165/j.ijabe.20181104.4278.
- Tang, Y. C., et al. (2020) Recognition and localization methods for vision-based fruit picking robots: A review. Frontiers in Plant Science, 11, p. 510. doi.org/10.3389/fpls.2020.00510.
- Ling, X., et al. (2019) Dual-arm cooperation and implementing for robotic harvesting tomato using binocular vision. Robotics and Autonomous Systems, 114, pp. 134–143. doi.org/10.1016/j.robot.2019.01.019.
- Qin, F., et al. (2016) Identification of alfalfa leaf diseases using image recognition technology. PLoS ONE, 11, e0168274. doi.org/10.1371/journal.pone.0168274.
- Chuanlei, Z., et al. (2017) Apple leaf disease identification using genetic algorithm and correlation based feature selection method. International Journal of Agricultural and Biological Engineering, 10, pp. 74–83. doi.org/10.3965/j.ijabe.20171002.2166.
- Al Bashish, D., et al. (2011) Detection and classification of leaf diseases using k-means-based segmentation and neural networks-based classification. The Journal of Information Technology, 10, pp. 267–275. doi.org/10.3923/itj.2011.267.275.
- Dhaygude, S B & Kumbhar, N P (2013) Agricultural plant leaf disease detection using image processing. International Journal of Advanced Research in Electrical, Electronics and Instrumentation Engineering, 2, pp. 599–602.
- Rajan, P., et al. (2016) Detection and classification of pests from crop images using support vector machine. In: Proceedings of the 2016 International Conference on Emerging Technological Trends (ICETT), Kollam, India, 21–22 October; pp. 1–6.
- Rumpf, T., et al. (2010) Early detection and classification of plant diseases with support vector machines based on hyperspectral reflectance. Computers and Electronics in Agriculture, 74, pp. 91–99. doi.org/10.1016/j.compag.2010.06.009.
- Islam, M., et al. (2017) Detection of potato diseases using image segmentation and multiclass support vector machine. In: Proceedings of the 2017 IEEE 30th Canadian Conference on Electrical and Computer Engineering (CCECE), Windsor, ON, Canada, 30 April–3 May; pp. 1–4.
- Wu, C., et al. (2018) A greedy deep learning method for medical disease analysis. IEEE Access, 6, pp. 20021–20030. doi.org/10.1109/ACCESS.2018.2823979.
- Lu, H., et al. (2018) Brain intelligence: Go beyond artificial intelligence. Mobile Networks and Applications, 23, pp. 368–375. doi.org/10.1007/s11036-017-0932-8.
- Li, J., et al. (2018) New secret sharing scheme based on faster R-CNNs image retrieval. IEEE Access, 6, pp. 49348–49357. doi.org/10.1109/ACCESS.2018.2821690.
- Kamilaris, A & Prenafeta-Boldú, F X (2018) Deep learning in agriculture: A survey. Computers and Electronics in Agriculture, 147, pp. 70–90. doi.org/10.1016/j.compag.2018.02.016.
- Lee, S. H., et al. (2017) How deep learning extracts and learns leaf features for plant classification. Pattern Recognition, 71, pp. 1–13. doi.org/10.1016/j.patcog.2017.05.015.
- Zhang, Y. D., et al. (2017) Image based fruit category classification by 13-layer deep convolutional neural network and data augmentation. Multimedia Tools and Applications, 78, pp. 3613–3632. doi.org/10.1007/s11042-017-5243-3.
- Tang, J. L., et al. (2017) Weed identification based on K-means feature learning combined with convolutional neural network. Computers and Electronics in Agriculture, 135, pp. 63–70. doi.org/10.1016/j.compag.2017.01.001.
- Arribas, J. I., et al. (2011) Leaf classification in sunflower crops by computer vision and neural networks. Computers and Electronics in Agriculture, 78, pp. 9–18. doi.org/10.1016/j.compag.2011.05.007.
- Dias, P. A., et al. (2018) Apple flower detection using deep convolutional networks. Computers & Industrial Engineering, 99, pp. 17–28. doi.org/10.1016/j.compind.2018.03.010.
- Yamamoto, K., et al. (2014) On plant detection of intact tomato fruits using image analysis and machine learning methods. Sensors, 14, pp. 12191–12206. doi.org/10.3390/s140712191.
- Caglayan, A & Can, A B (2018) Volumetric object recognition using 3-D CNNs on depth data. IEEE Access, 6, pp. 20058–20066. doi.org/10.1109/ACCESS.2018.2820840.
- Lu, H., et al. (2018) Low illumination underwater light field images reconstruction using deep convolutional neural networks. Future Generation Computer Systems, 82, pp. 142–148. doi.org/10.1016/j.future.2018.01.001.
- Fuentes, A., et al. (2017) A robust deep-learning-based detector for real-time tomato plant diseases and pests recognition. Sensors, 17, p. 2022. doi.org/10.3390/s17092022.
- Fuentes, A. F., et al. (2018) High-performance deep neural network-based tomato plant diseases and pests diagnosis system with refinement filter bank. Frontiers in Plant Science, 9, p. 1162. doi.org/10.3389/fpls.2018.01162.
- Fuentes, A. F., et al. (2019) Deep learning-based phenotyping system with glocal description of plant anomalies and symptoms. Frontiers in Plant Science, 10, p. 1321. doi.org/10.3389/fpls.2019.01321.
- Mohanty, S. P., et al. (2016) Using deep learning for image-based plant disease detection. Frontiers in Plant Science, 7, p. 1419. doi.org/10.3389/fpls.2016.01419.
- Lu, J., et al. (2017) An in-field automatic wheat disease diagnosis system. Computers and Electronics in Agriculture, 142, pp. 369–379. doi.org/10.1016/j.compag.2017.09.012.
- Lu, Y., et al. (2017) Identification of Rice diseases using deep convolutional neural networks. Neurocomputing, 267, pp. 378–384. doi.org/10.1016/j.neucom.2017.06.023.
- Liu, B., et al. (2017) Identification of apple leaf diseases based on deep convolutional neural networks. Symmetry, 10, p. 11. doi.org/10.3390/sym10010011.
- Zhang, X., et al. (2018) Identification of maize leaf diseases using improved deep convolutional neural networks. IEEE Access, 6, pp. 30370–30377. doi.org/10.1109/ACCESS.2018.2844405.
- Lin, T.-Y., et al. (2017) Focal loss for dense object detection. In Proceedings of the IEEE International Conference on Computer Vision, Venice, Italy, 22–29 October; pp. 2980–2988.
- Ross, G (2015) Fast r-cnn. In Proceedings of the IEEE international Conference on Computer Vision, Santiago, Chile, 7–13 December; pp. 1440–1448.
- Ren, S., et al. (2015) Faster R-CNN: Towards Real-Time Object Detection with Region Proposal Networks. IEEE Transactions on Pattern Analysis and Machine Intelligence, 39, pp. 1137–1149.
- Kaiming, H., et al. (2017) Mask r-cnn. In Proceedings of the IEEE International Conference on Computer Vision, Venice, Italy, 22–29 October; pp. 2961–2969.
- Bargoti, S & Underwood, J (2017) Deep fruit detection in orchards. In Proceedings of the 2017 IEEE International Conference on Robotics and Automation (ICRA), Singapore, 29 May–3 June; pp. 1–8.
- Inkyu, S., et al. (2016) DeepFruits: A fruit detection system using deep neural networks. Sensors, 16, p. 1222. doi.org/10.3390/s16081222.
- Simonyan, K & Zisserman, A (2014). Very deep convolutional networks for large-scale image recognition. arXiv: 1409.1556.
- Redmon, J., et al. (2016) You only look once: Unified, real-time object detection. In Proceedings of the IEEE Conference on Computer Vision and Pattern Recognition, Las Vegas, NV, USA, 27–30 June; pp. 779–788.
- Redmon, J & Farhadi, A (2017) YOLO9000: Better, faster, stronger. In Proceedings of the IEEE Conference on Computer Vision and Pattern Recognition, Honolulu, HI, USA, 21–26 July; pp. 6517–6525.
- Redmon, J & Farhadi, A (2018) YOLOv3: An incremental improvement. In Proceedings of the IEEE Conference on Computer Vision and Pattern Recognition, Salt Lake City, UT, USA, 18–22 June.
- Bochkovskiy, A., et al. (2020) YOLOv4: Optimal Speed and Accuracy of Object Detection. arXiv: 2004.10934.
- Misra, D (2019) Mish: A self-regularized non-monotonic neural activation function. arXiv: 1908.08681.
- Huang, G., et al. (2017) Densely connected convolutional networks. In Proceedings of the IEEE Conference on Computer Vision and Pattern Recognition, Honolulu, HI, USA, 21–26 July; pp. 2261–2269.
- Ramachandran, P., et al. (2017) Searching for activation functions. arXiv: 1710.05941.
- Maas, A. L., et al. (2013) Rectifier nonlinearities improve neural network acoustic models. In Proceedings of the ICML 2013, Atlanta, GA, USA, 16–21 June.
- He, K., et al. (2015) Spatial pyramid pooling in deep convolutional networks for visual recognition. IEEE Transactions on Pattern Analysis and Machine Intelligence (TPAMI), 37, pp. 1904–1916. doi.org/10.1007/978-3-319-10578-9_23.
- Liu, S., et al. (2018) Path Aggregation Network for Instance Segmentation. In Proceedings of the IEEE Conference on Computer Vision and Pattern Recognition, Salt Lake City, UT, USA, 18–22 June; pp. 8759–8768.
- Ghiasi, G., et al. (2018) Dropblock: A regularization method for convolutional networks. In Proceedings of the Advances in Neural Information Processing Systems, Montréal, QC, USA, 3–8 December; pp. 10727–10737. Available at: https://arxiv.org/pdf/1810.12890.pdf (accessed on 11 December 2020).
- Zheng, Z., et al. (2020) Distance-IoU loss: Faster and better learning for bounding box regression. In Proceedings of the AAAI Conference on Artificial Intelligence, New York, NY, USA, 7–11 February; Volume 34, No. 7. pp. 12993–13000.
- Kaggle PlantPathology Apple Dataset 2020. Available at: https://www.kaggle.com/piantic/plantpathology-apple-dataset (accessed on 9 March 2021).
- LabelImg 2021. Available at: https://github.com/tzutalin/labelImg (accessed on 24 March 2021).